-
Select format
-
- Publisher:
- Cambridge University Press
- Publication date:
- 11 December 2025
- 22 January 2026
- ISBN:
- 9781009636049
- 9781009636032
- Dimensions:
- (228 x 152 mm)
- Weight & Pages:
- 278 Pages
- Dimensions:
- Weight & Pages:
You may already have access via personal or institutional login
Book description
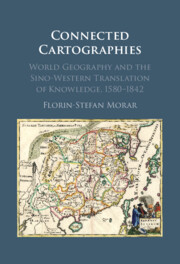
In the 'Age of Discovery', explorers brought a wealth of information about new and strange lands from across the oceans. Yet, even as the Americas appeared on new world maps, China remained a cartographic mystery. How was the puzzle of China's geography unravelled? Connected Cartographies demonstrates that knowledge about China was generated differently, not through exploration but through a fascinating bi-directional cross-cultural exchange of knowledge. Florin-Stefan Morar shows that interactions between Chinese and Western cartographic traditions led to the creation of a new genre of maps that incorporated features from both. This genre included works by renowned cartographers such as Abraham Ortelius and Matteo Ricci and other less-known works, 'black tulips of cartography,' hidden in special collections. Morar builds upon original sources in multiple languages from archives across three continents, producing a pioneering reconstruction of Sino-Western cartographic exchanges that shaped the modern world map and our shared global perspective.
Reviews
‘Morar carries forward recent shifts in cartographic history to challenge the idea that Europe ‘discovered' the rest of the world by looking closely at how cartographers, both European and Chinese, crossed cultures as they put the world together on paper.'
Timothy Brook - University of British Columbia
In this masterful study, Morar charts how translation and adaptation-not just exploration-crafted early global perspectives in both China and Europe. ‘Connected Cartographies' offers a fresh perspective on how Jesuit maps, Manchu border policies, and Qing expansion reshaped the meaning of ‘empire' and ‘border' itself, underscoring the importance of hybrid cartographic traditions for modern global history.
Hyunhee Park - The City University of New York
‘Connected Cartographies' offers a compelling narrative of the interactive co-emergence of early modernity in China and Europe in the fields of world geography and cartography.
Qiong Zhang - Wake Forest University
Contents
Metrics
Full text views
Full text views help Loading metrics...
* Views captured on Cambridge Core between #date#. This data will be updated every 24 hours.
Usage data cannot currently be displayed.
Accessibility standard: WCAG 2.2 AAA
Why this information is here
This section outlines the accessibility features of this content - including support for screen readers, full keyboard navigation and high-contrast display options. This may not be relevant for you.
Accessibility Information
The PDF of this book complies with version 2.2 of the Web Content Accessibility Guidelines (WCAG), offering more comprehensive accessibility measures for a broad range of users and attains the highest (AAA) level of WCAG compliance, optimising the user experience by meeting the most extensive accessibility guidelines.
Content Navigation
Table of contents navigation
Allows you to navigate directly to chapters, sections, or non‐text items through a linked table of contents, reducing the need for extensive scrolling.
Index navigation
Provides an interactive index, letting you go straight to where a term or subject appears in the text without manual searching.
Reading Order and Textual Equivalents
Single logical reading order
You will encounter all content (including footnotes, captions, etc.) in a clear, sequential flow, making it easier to follow with assistive tools like screen readers.
Short alternative textual descriptions
You get concise descriptions (for images, charts, or media clips), ensuring you do not miss crucial information when visual or audio elements are not accessible.
Full alternative textual descriptions
You get more than just short alt text: you have comprehensive text equivalents, transcripts, captions, or audio descriptions for substantial non‐text content, which is especially helpful for complex visuals or multimedia.
Visualised data also available as non‐graphical data
You can access graphs or charts in a text or tabular format, so you are not excluded if you cannot process visual displays.
Visual Accessibility
Use of high contrast between text and background colour
You benefit from high‐contrast text, which improves legibility if you have low vision or if you are reading in less‐than‐ideal lighting conditions.

