

1. Introduction
One of the major goals in dialectology is to understand how language variation is structured spatially. The traditional dialectological approach to this is to collect production data from a geographically stratified sample of dialect speakers, and to use this to construct isoglosses that objectively delineate the areal distribution of specific linguistic features. A bundle of isoglosses is used to justify dialect boundaries, which enables researchers to postulate meso- or macro-level dialect classifications. However, it is well understood that the study of any linguistic variable only makes sense if its users perceive and judge such a variable to be relevant in sociolinguistic interaction. In other words, such objective classifications by dialectologists need not have any bearing on the subjective perception and use by language users. The latter is studied by the field of perceptual dialectology (Preston, Reference Preston1981, Reference Preston1999). Perceptual dialectology has come up with diverse methods to tap into the way listeners subjectively ascribe social meaning to diatopic variation, which ultimately boils down to the elicitation of perceptual boundaries between varieties and geographical space. We refer to these as perceptual isoglosses. Focusing on regional accents, this paper introduces a new task in this tradition called the “map-based accent-recognition task.” Furthermore, the paper shows how this task can be applied to Dutch as spoken in the Netherlands—the language situation of one of the very first perceptual-dialectological studies by Pieter Willems (1885: see Belemans, Reference Belemans2015).
The map-based accent-recognition task first appeared in Pinget & Voeten (Reference Pinget and Voeten2023), where perceptual isoglosses were only used indirectly, namely to identify listener-based factors in accent recognition. The present paper takes the task a step further, by showing how the same dataset can be used to map out the perceptual landscape of, in this case, the Netherlands. It demonstrates how the task can be used to reach novel conclusions about listeners’ mental representations of the spoken diatopic variation in a given linguistic situation. In so doing, we complement the long-standing tradition of production-based measures of (Dutch) dialectology with information from the converse side of perception, and demonstrate a methodological and data-analytical approach towards doing so.
There are four specific goals to the present paper. The first goal is to introduce the map-based accent-recognition task; this is done in Section 3, after Section 2 has set up the context within perceptual dialectology. The second goal is to demonstrate one very relevant type of output that the task can produce: a map showing direct perceptual associations between speech and space (Section 4). The third goal is to validate these perceptual associations (in Section 5) by showing that the perception distances obtained in Section 4 display convergent validity with independently collected production distances. Finally, the fourth goal of the paper is to draw new conclusions on the nature of the Dutch dialect continuum as it exists throughout the Netherlands (Section 6). This goal is achieved by charting out a map of the dialect regions, based entirely in perception. Finally, the paper ends with a general discussion (Section 7) and conclusion (Section 8).
2. Background
Research in perceptual dialectology utilizes a broad variety of methods and focuses, which are summarized in Preston (Reference Preston1999) and Purschke & Stoeckle (Reference Purschke and Stoeckle2019), for example. In brief, previous work has involved both stimulus-driven and mental tasks, which tap into conscious or unconscious associations, and provide different levels of focus in the linguistic area (micro-, meso- or macro-level). As a thorough review of all the existing types of studies and paradigms in perceptual dialectology is beyond the scope of the present paper, we focus here specifically on those studies which involved regional accents, particularly those involving Dutch.
One of the pioneering studies in perceptual dialectology was Weijnen’s (Reference Weijnen1946) “little-arrow method.” Weijnen (Reference Weijnen1946) derived dialect areas in the Netherlands by encircling areas that were connected by similar arrows connecting a respondent’s home area to the other areas which the respondent said were similar. Conversely, drawing lines between places with no or very few arrows gave rise to what we can call perceptual isoglosses. Research in this vein became known as perceptual dialectology in the 1980s, due to Dennis Preston. In Preston’s original “draw-a-map” task (Preston, Reference Preston1981), listeners indicate by hand on a printed map where they believe dialect boundaries to exist. Like previous work, this is a purely mental task: researchers do not provide listeners with speech stimuli for this task, as they aim to gain more understanding of listeners’ mental representation of variation. While individual maps obtained with “draw-a-map” tasks are insightful, the real power of this type of study lies in the aggregation of these maps. The data can be aggregated into a composite mental map, produced by the superposition of lines on the maps (e.g. Preston, Reference Preston1986; Onishi & Long, Reference Onishi and Long1997), and later through the use of GIS tools and digital maps (see Montgomery, Reference Montgomery, Kircher and Zipp2022, and Montgomery & Stoeckle, Reference Montgomery and Stoeckle2013). This approach has been applied in numerous later studies and has provided new insights into a wide range of linguistic situations in those areas, including the United States (Benson, Reference Benson2003; Bucholtz et al., Reference Bucholtz, Nancy Bermudez, Edwards and Vargas2007; Evans, Reference Evans2011, Reference Evans2013; Cukor-Avila et al., Reference Cukor-Avila, Jeon, Rector, Tiwari and Shelton2012; Cramer, Reference Cramer2016; Cramer, Tamasi & Bounds, Reference Cramer, Tamasi and Bounds2018), various European language areas (Kuiper, Reference Kuiper and Preston1999; Williams, Garrett & Coupland, Reference Williams, Garrett, Coupland and Preston1999; Diercks, Reference Diercks, Long and Preston2002; Romanello, Reference Romanello, Long and Preston2002; Montgomery, Reference Montgomery2007; Anders, Reference Anders2010; Lameli, Reference Lameli, Auer and Schmidt2010; Braber, Reference Braber2014; Bounds, Reference Bounds2015; Cramer & Montgomery, Reference Cramer and Montgomery2016; Cornips, Reference Cornips2018), and areas in other parts of the world (e.g. Demirci & Kleiner, Reference Demirci, Kleiner and Preston1999; Long & Yim, Reference Long, Yim, Long and Preston2002; Jeon & Cukor-Avila, Reference Jeon and Cukor-Avila2015).
The above-mentioned tasks are mental tasks (hence why their output products are referred to as mental maps), that is, they do not involve the presentation of actual stimuli. At least as early as 1989, Preston (Reference Preston and Ammon1989b) developed a supplement to the draw-a-map task. In his study of US English, participants performed various tasks, which included drawing a map by hand but also included a task where they had to place nine fragments of spontaneous speech, sampled from north to south across the United States, on a map. This latter task is an example of a stimulus-driven task, in which sociolinguistic representations are directly activated by speech stimuli, as opposed to being activated indirectly through whatever stereotypical beliefs the listener may have (or think they have). Various innovations and generalizations of this task have been proposed since, such that roughly three approaches can be distinguished: forced-choice categorization (e.g. Clopper & Pisoni, Reference Clopper and Pisoni2006; Kristiansen, Zenner & Geeraerts, Reference Kristiansen, Zenner and Geeraerts2018), free responses (e.g. Clopper & Pisoni, Reference Clopper and Pisoni2007; Bent & Holt, Reference Bent and Holt2017), or asking listeners to pinpoint on a map where they believe the speaker to be from (e.g. Plichta & Preston, Reference Plichta and Preston2005; Cramer, Reference Cramer2010; Pinget & Voeten, Reference Pinget and Voeten2023). In addition, these types of task have been deployed in various countries such as the United States (Plichta & Preston, Reference Plichta and Preston2005; Clopper & Pisoni, Reference Clopper and Pisoni2007; McCullough, Clopper & Wagner, Reference McCullough, Clopper and Wagner2019), the UK (Williams, Garrett & Coupland, Reference Williams, Garrett, Coupland and Preston1999), and of particular relevance here, the Netherlands (Van Bezooijen & Gooskens, Reference Van Bezooijen and Gooskens1999; Diercks, Reference Diercks, Long and Preston2002). Of particular note is Plichta & Preston (Reference Plichta and Preston2005), which is not only—to our knowledge—the first study to have used manipulated stimuli (specifically, an LPC-synthesized continuum of different degrees of [aɪ]-monophthongization), but is also among the first studies to be carried out entirely online, that is, participants did the task on their own computer in their internet browser, rather than having to come to the lab. Like that task, the present map-based accent-recognition task is also an online task where listeners have to place an auditorily presented speech fragment on a map. Cramer (Reference Cramer2010) is also notable as pioneer work for the current study. Her study aimed to show that American English speakers (from Louisville) are able to accurately identify a speaker as being from their own place of origin, based on sound alone. It was also a web-based survey, in which subjects were presented with short segments of speech and asked to pinpoint on a map of a small region of the United States where they believed the speaker to be from. Cramer’s maps were blank maps which only included several cities as “guideposts” (Cramer, Reference Cramer2010:106). The current work expands along these lines by allowing listeners to make use of both the stimuli and in a fully fledged geographical map to provide us with data about their perception of dialectological variation.
The details of our task, and the considerations that went into its design, are discussed in Section 3.
3. The map-based accent-recognition task: nature and implementation
3.1. Linguistic context
The map-based accent-recognition task is implemented in the context of Standard Dutch as spoken in the Netherlands (Flanders, Suriname, and the Dutch Caribbean—where other varieties of Dutch are spoken—are left out of consideration here). Standard Dutch is a supraregional (and even supranational) language variety that is highly standardized at the lexical, syntactic, and phonological level. When speakers from the Netherlands aim to speak Standard Dutch, they often produce a variety that retains some phonetic variants indexing the speaker’s local regional origin (van Heuven & Van de Velde, 2010). Among others, Pinget, Rotteveel & Van de Velde (Reference Pinget, Rotteveel and Van de Velde2014) defined this variety as “Standard Dutch with an accent”: a variety that is still considered to be standard, but shows notable regional variation at the phonetic level (e.g. van Hout et al., Reference Van de Velde, Houtermans, Huls and Weltens1999; van der Harst, Reference Harst2011). This variety will be under consideration in the current study.
The phonetic variants that define these regional accents originate from the corresponding regional dialects. Like many European countries, the Netherlands have seen significant dialect levelling and loss over the past few centuries, making Standard Dutch the predominant language variety by far (e.g. Willemyns, Reference Willemyns, Deumert and Vandebussche2003; we refer to Smakman, Reference Smakman2006 and Doreleijers, Reference Doreleijers2024 for an extensive overview and a deeper discussion of the relevant factors). At the same time, ample features of the dialects remain, both in regiolects (Hoppenbrouwers, Reference Hoppenbrouwers1990) and in destandardized features of the standard (Grondelaers & van Hout, Reference Grondelaers and van Hout2011). Focusing on phonetic (i.e. regional-accent) features, van Hout et al. (Reference Van de Velde, Houtermans, Huls and Weltens1999) compiled the Flemish–Dutch Teacher Corpus, which contains recordings of high-school teachers of Dutch who were instructed to speak the standard language in a sociolinguistic interview. Sociophoneticians (e.g. Adank, Reference Adank2003; van der Harst, Reference Harst2011; Voeten, Reference Voeten2021b) have found that these teachers’ interpretations of the standard language retain ample instances of phonetic variation that can be traced back to the regional dialects originally spoken in the teachers’ home areas. This is representative of the general state of affairs of Standard Dutch with an accent.
At the perceptual level, previous work has shown that listeners can use these regional phonetic features to identify speakers’ regional provenances, though the accuracy and extent of these regional connotations seem to depend on both the accentedness of the speakers and the experience of the listener (Van Bezooijen & Gooskens, Reference Van Bezooijen and Gooskens1999; Pinget, Rotteveel & Van de Velde, Reference Pinget, Rotteveel and Van de Velde2014). We hence expect this phonetic substrate in production to have a mild but detectable influence on listeners’ perception. An open question in this context, which we address in this paper, is whether these regional influences organize in the form of perceptual isoglosses—and if so, what those look like. Section 3.2 discusses how we approach this question methodologically.
3.2. Implementation in the map-based accent-recognition task
In light of the information presented above, it was important for our task that both the speech materials and the listeners’ regional origins were sufficiently diverse, so that both would provide a representative sample of the sociolinguistic variation in Standard Dutch with an accent. For our speech materials, we ensured the representativeness by sampling two places from each of the most important dialectological regions of the Netherlands (based on the map by Daan & Blok, Reference Daan and Blok1969) with the exception of FrieslandFootnote 1 and by controlling for a good geographical spread between these places. Map 1 shows an overview of the places that were selected. The distribution of places is relatively uniform over the country, is approximately stratified by the provinces, includes both big cities and smaller places, and covers the most important dialectological areas of the Netherlands (see Goossens, Taeldeman & Verleyen, Reference Goossens, Taeldeman and Verleyen1998, Reference Goossens, Taeldeman and Verleyen2000, and De Wulf, Goossens & Taeldeman, Reference De Wulf, Goossens and Taeldeman2005 for a thorough compilation of the relevant dialectological maps).
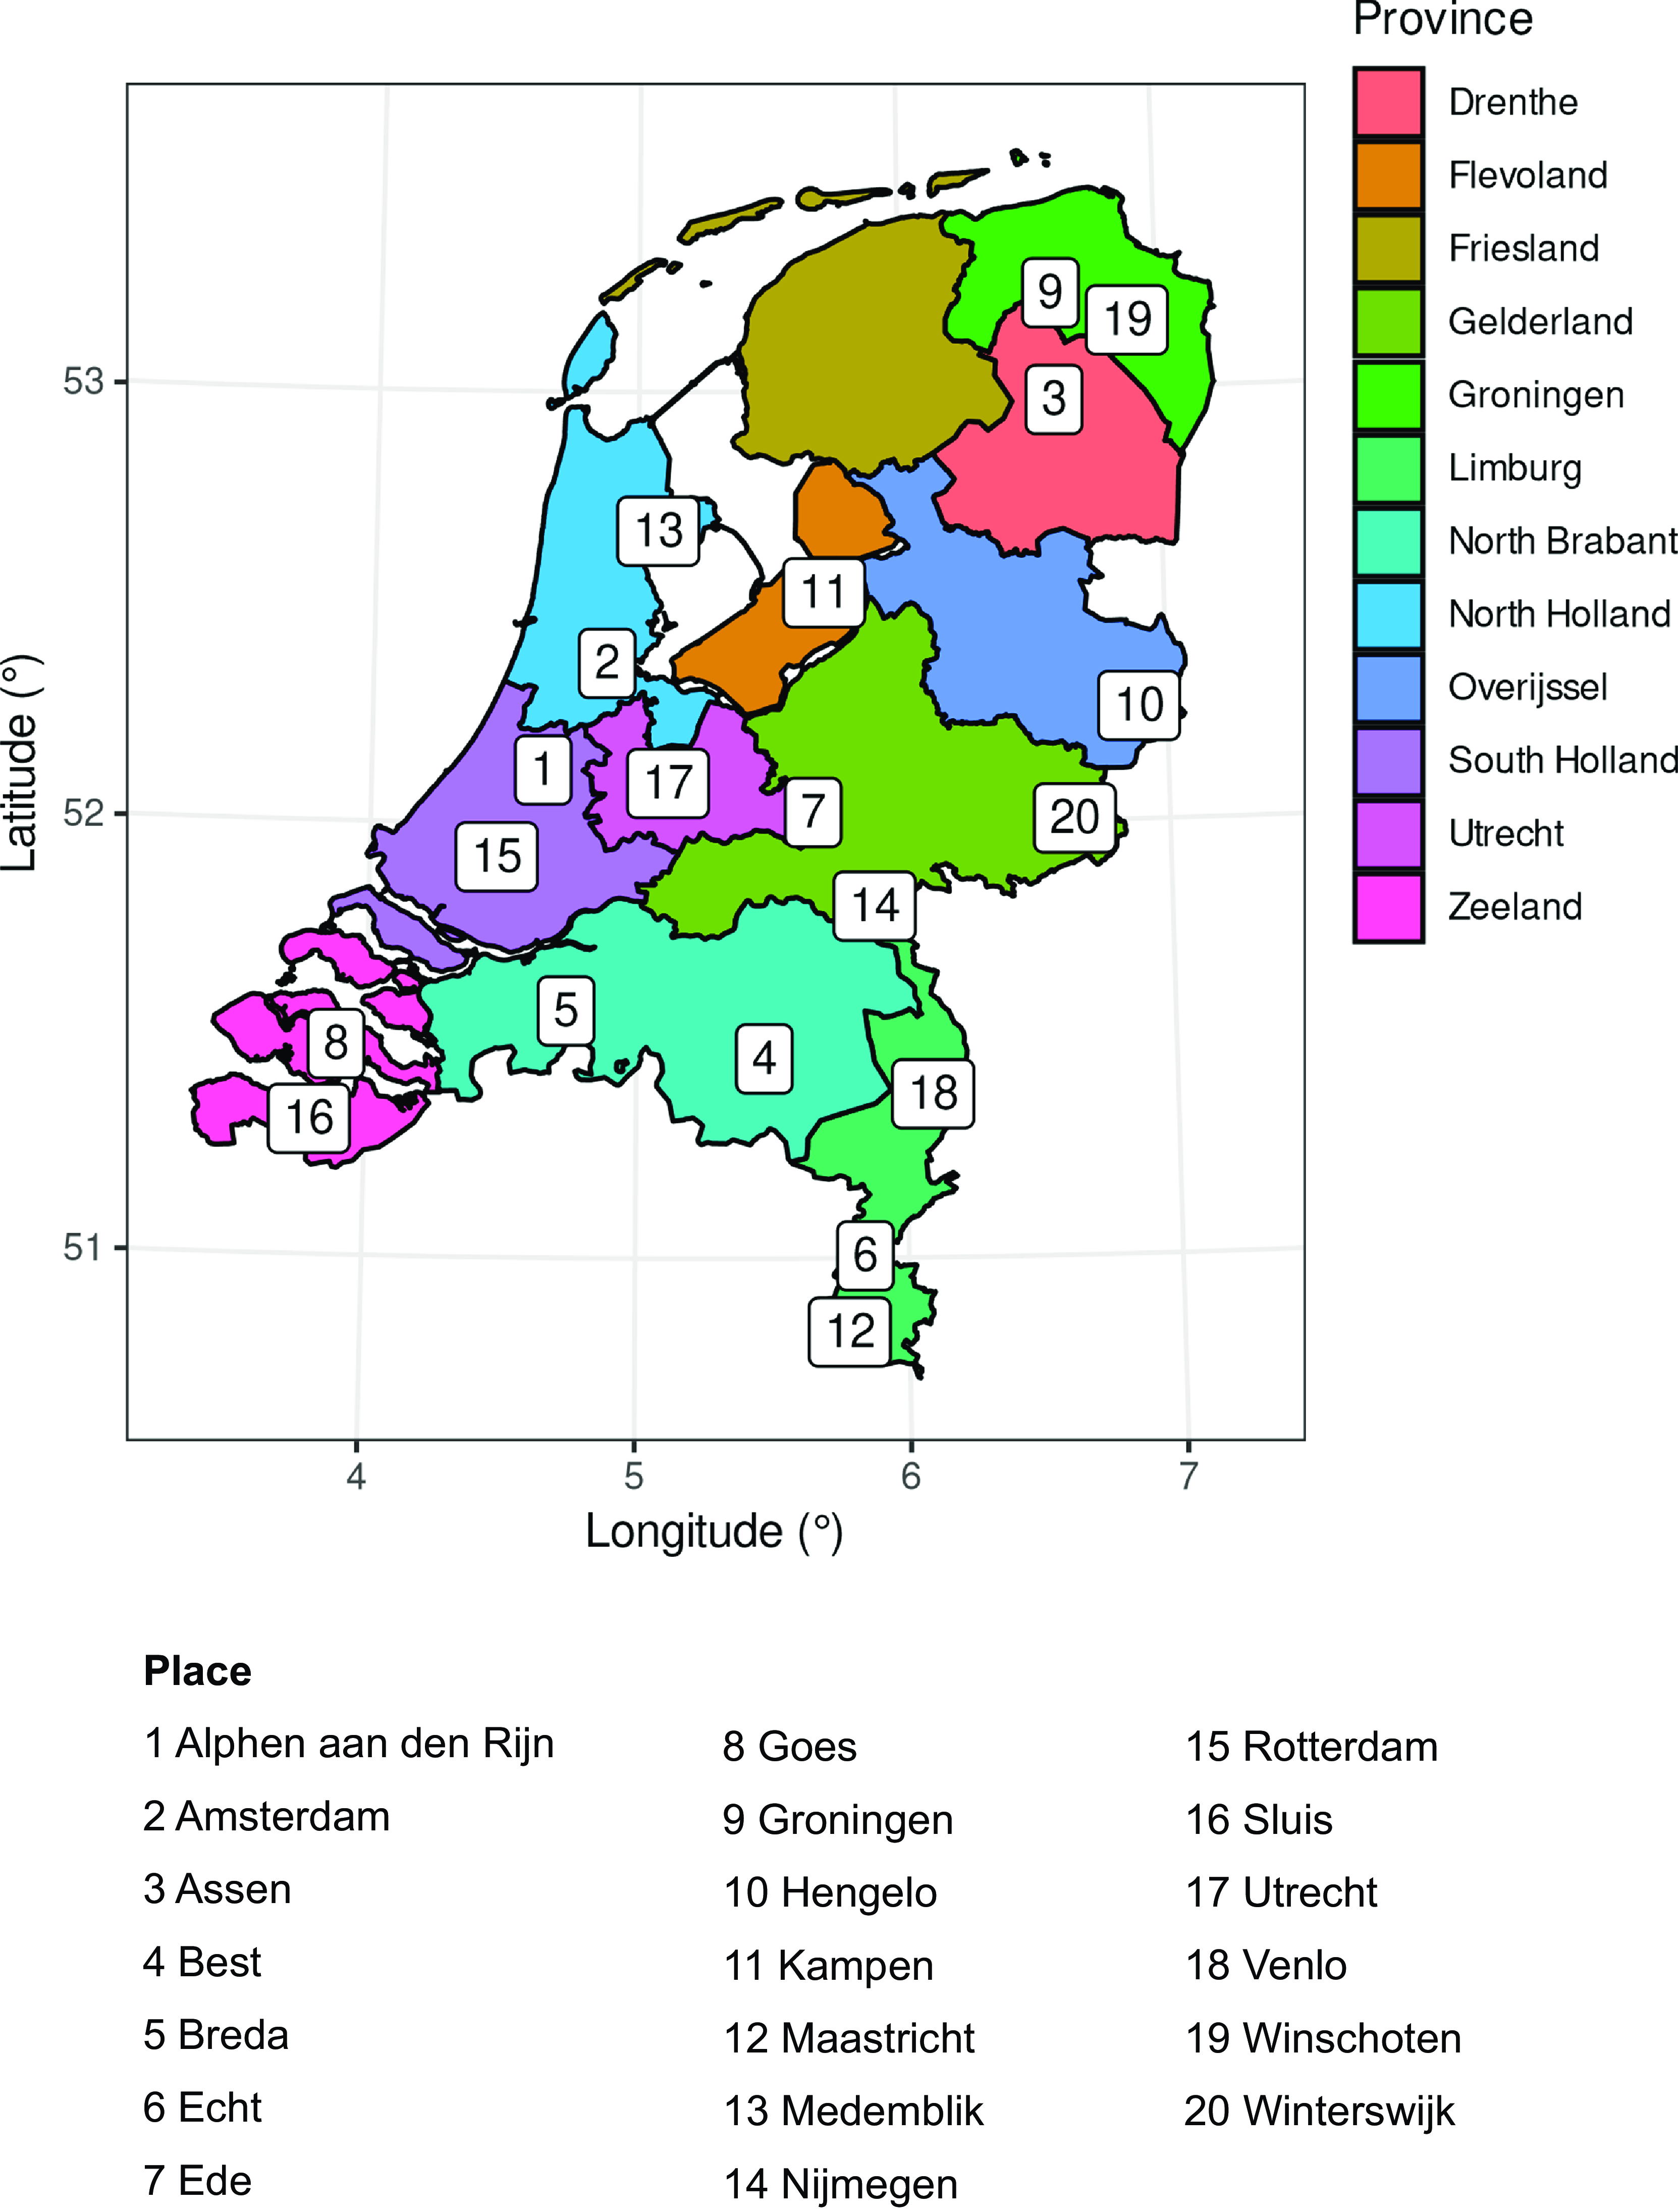
Map 1. Geographical origins of the speakers (n = 40). All twenty origins (two speakers per site) are indicated by a number from 1 to 20 on the map of the Netherlands. For reference, and to facilitate a comparison to the areas to be identified in Figure 6, the provinces’ labels and boundaries are also given.
The selected speech materials from these places consisted of 20-second fragments (a usual length of stimuli in this type of study; see also Watson & Clark, Reference Watson and Clark2015), extracted from the Spoken Dutch Corpus (Oostdijk, Reference Oostdijk, Peters, Collins and Cohen2002). While the fragments comprised various recording settings (e.g. informal interviews, recorded telephone conversations with friends, spontaneous conversation among friends), in all selected cases speech was informal and spontaneous, while speakers were aware that they were being recorded for a corpus specifically concerned with Standard Dutch. For a discussion of the possible implications hereof, we refer to Oostdijk (Reference Oostdijk, Peters, Collins and Cohen2002). While macro-level sociolinguistic data on the speakers was available (e.g. gender, age, birthplace), the corpus does not include additional sociolinguistically relevant information such as the speakers’ attitudes or affiliations to their birth or current regions; we hence necessarily leave consideration of these matters to future work.
Two fragments were extracted per location: one from a female speaker and one from a male speaker. The selected speakers all reported being born and raised in the specific location. Moreover, they reported having lived there the longest part of their lives. The 20-second fragments did not contain any direct clue that could give away speakers’ age, social class, or regional origin (e.g. speakers naming adjacent places, local dishes, etc.). Moreover, each fragment was thoroughly checked to ensure that no lexical or morphosyntactic shibboleths were present. In this way, only phonetic variation was available in the speech as possible cue for accent recognition. Note that lexical and morphosyntactic features are in general quite rare in the Spoken Dutch Corpus, because all speakers had been instructed to speak Standard Dutch. As explained in Section 3.1, this meant that in practice all speakers spoke “Standard Dutch with an accent.”
While a detailed acoustic analysis of the regional features that were present in the speech samples is beyond the scope of the present paper, listening to the samples impressionistically yielded eight noteworthy variables.
-
1. The realization of (x). The distinction between what nonlinguists call “hard” and “soft” realizations of (x) is arguably the most well-known shibboleth in the Netherlands (see van der Harst, Van de Velde & Schouten, Reference Harst, Van de Velde and Schouten2007). Speakers to the north of the Great RiversFootnote 2 are claimed to speak with a “hard g” (a voiceless uvular fricative), while speakers from south of the rivers speak with a “soft g” (a velar or even palatal fricative, with a voicing distinction as well). This generally applies to our data as well, albeit with some exceptions (the female speakers from Nijmegen and Best, the male speaker from Breda: while they all otherwise represent their regions’ accents as expected, on the particular variable of (x) they use the more prestigious uvular fricative).
-
2. The realization of (r). Depending on the level of description, Netherlandic Dutch has as many as twenty different rhotic variants (Sebregts, Reference Sebregts2014), with reliable regional differences; we refer to Sebregts (Reference Sebregts2014) for a thorough overview.
-
3. The realization of (ϵi). As first observed by Stroop (Reference Stroop1998), an ongoing sound change in the Netherlands is the lowering of [ϵi] to [ai]. Stroop (Reference Stroop1998) and Jacobi (Reference Jacobi2009) report that it is especially strong in the Amsterdam area, which our stimuli confirm; furthermore, the areas in the province of Limburg (Venlo, Echt, Maastricht) do not participate in this change (Voeten, Reference Voeten2021b), which our stimuli confirm as well.
-
4. The tense mid vowels (eː, øː, oː). Most of the Netherlands realizes the tense mid vowels as contextually restricted upgliding diphthongs, but speakers from eastern areas (especially southeastern ones, including Nijmegen and places to its south) realize them as monophthongs (Voeten, Reference Voeten2021b). We observe this in our stimuli as well.
-
5. The realization of (ϵ). The /ϵ/ phoneme does not really fit into the Dutch vowel system, being a lax vowel with no tense counterpart (van Oostendorp, Reference Oostendorp2000). A consequence of this that has been noted is that speakers from the southeast (particularly the city of Nijmegen and the province of Limburg) tend to lower it to [æ] (van Hout, Adank & van Heuven, Reference Van de Velde and van Hout2000). We observe this in most of our fragments coming from this area.
-
6. /t/-deletion. A typical feature of the south of the country (Goeman, Reference Goeman1999), particularly the province of Brabant (Breda, Best), is deletion of /t/ at the end of function words (e.g. /dɑt/ ‘that’ being realized as [da]). We observe this too in our speakers from those areas.
-
7. Syllabic /n/. A typical feature of northern speech is that /ən/ sequences as found in verb infinitives or noun plurals are reduced to [n̩], rather than to the more common variant [ə] (Van de Velde & van Hout, Reference Van de Velde and van Hout2000, Reference Van de Velde and van Hout2002). While not all of our speakers from northern areas exhibit this, some do.
-
8. Suprasegmentals. Especially the peripheral varieties have overall suprasegmental differences, of which nonlinguist native speakers are well aware, and which they can even imitate. We refer to Hanssen, Gussenhoven & Peters (Reference Hanssen, Gussenhoven, Peters, Zhang and Qian2019) and Gooskens (Reference Gooskens1997). In our speech fragments, this was particularly apparent from the northeastern parts of the country, which had a distinctly nasal quality, and in the fragments from the provinces of Brabant and Limburg, which had noticeably different intonation contours from the other fragments (and from each other).
In our discussion of the results, we will refer to these variables where relevant.
The implementation of the map-based accent-recognition task was done by embedding Google Maps into an online experiment administered using LimeSurvey. The survey materials are available at https://github.com/UUDigitalHumanitieslab/accent-recognition-limesurvey. Each participant was assigned a semi-random subset of ten speech stimuli, five from male speakers and five from female speakers. Using their own computer and web browser, participants were presented the interface shown in Figure 1. They were able to play the speech fragments several times if required, and then had to click on the map where they believed the speaker to be from. Participants’ ability to click was disabled outside the borders of the Netherlands and in lakes within the Netherlands. After each trial, participants received feedback on the correct origin of the speaker after each trial. Their response was considered “correct” when placements on the map happened within 15 kmFootnote 3 of each true speaker origin. Otherwise, they got an indication of the distance between the true location and the response they had provided. At the end of the experiment, participants were also given a short background questionnaire, and received a “final score” based on the number of “correct” responses and the averaged distance between given and target placements. We encouraged participants to spread the experiment on social media.
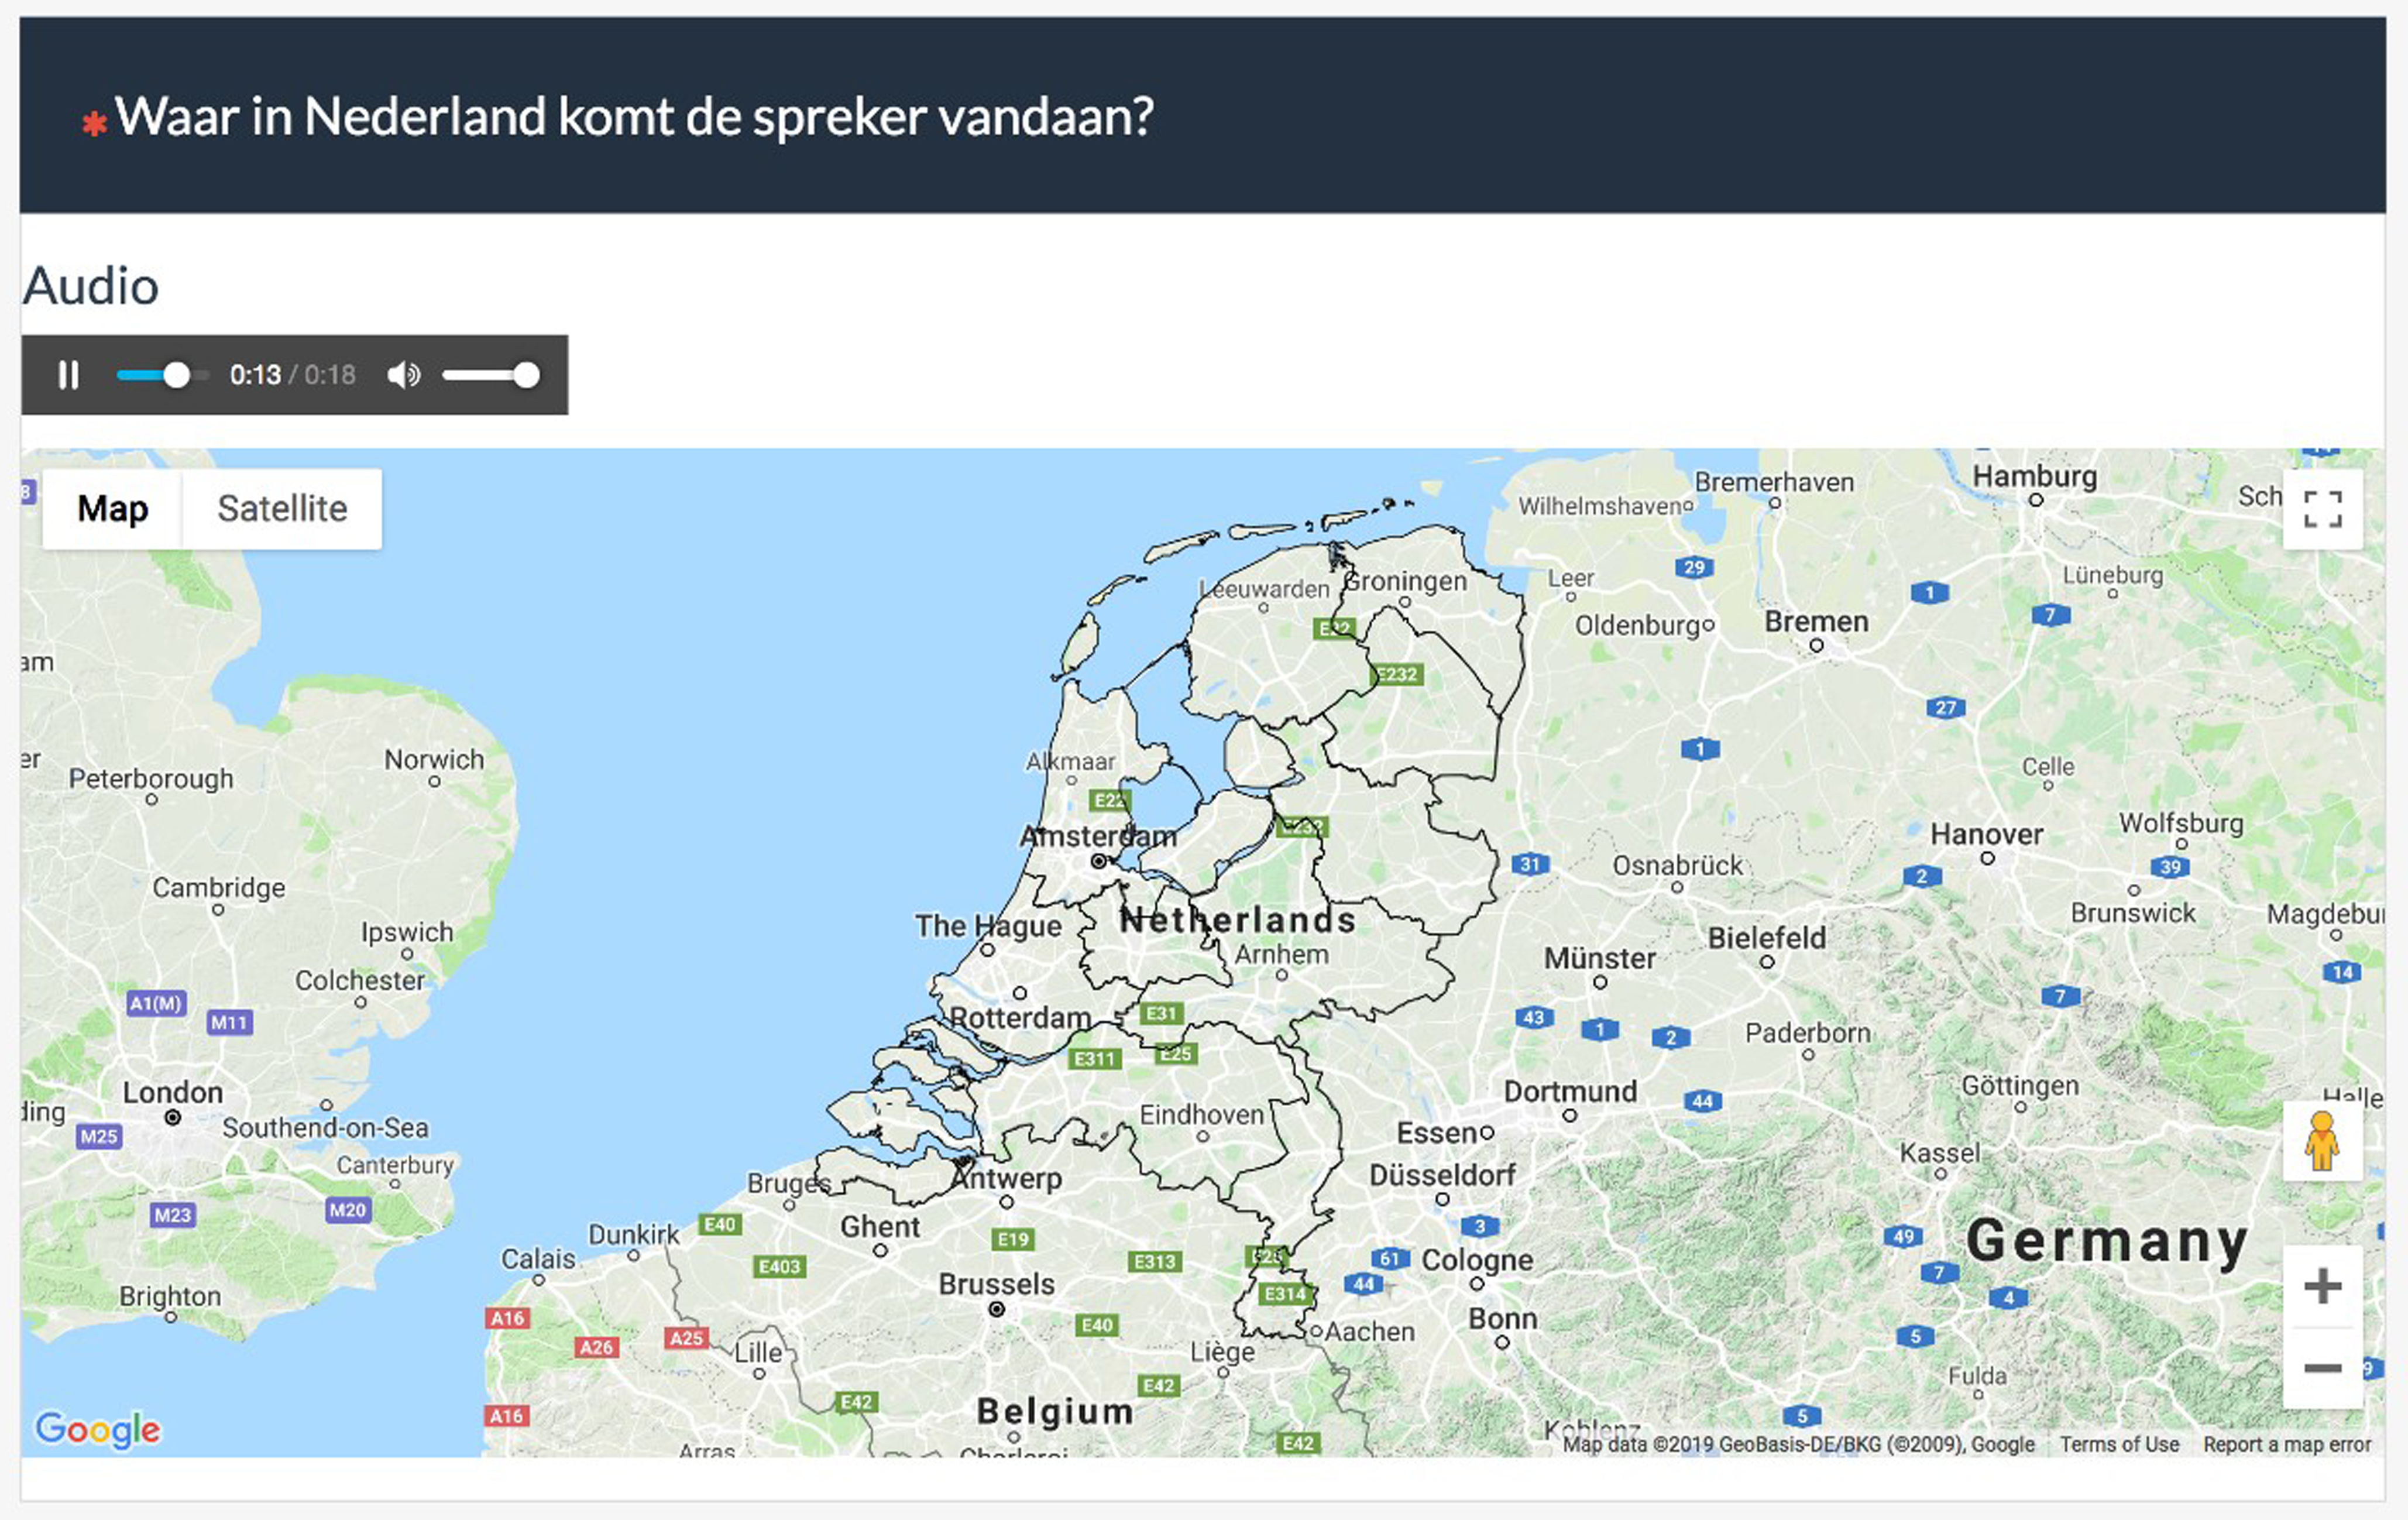
Figure 1. Example of a trial in the map-based recognition task (Question in Dutch: “Where in the Netherlands does the speaker come from?”)
An adequate and regionally representative sample of listeners was collected by crowd-sourcing the experiment: it was shared on several social media and language-related platforms. Participants were also encouraged to share it with their friends and relatives. We were able to collect data from 1,578 native Dutch listeners (886 men, 692 women; mean age = 39.53 years, SD = 14.19 years; see Pinget & Voeten, Reference Pinget and Voeten2023, for a more thorough breakdown by listener-related factors and their effects on task performance), who were born and raised all over the country (see Map 2). The sample showed the expected bias towards more densely populated regions of the country. Important aspects to obtaining this many respondents were the short duration, the gamification and challenge nature of the experiment, as explained above. As each listener judged ten items, the sample yielded 15,780 data points for analysis.
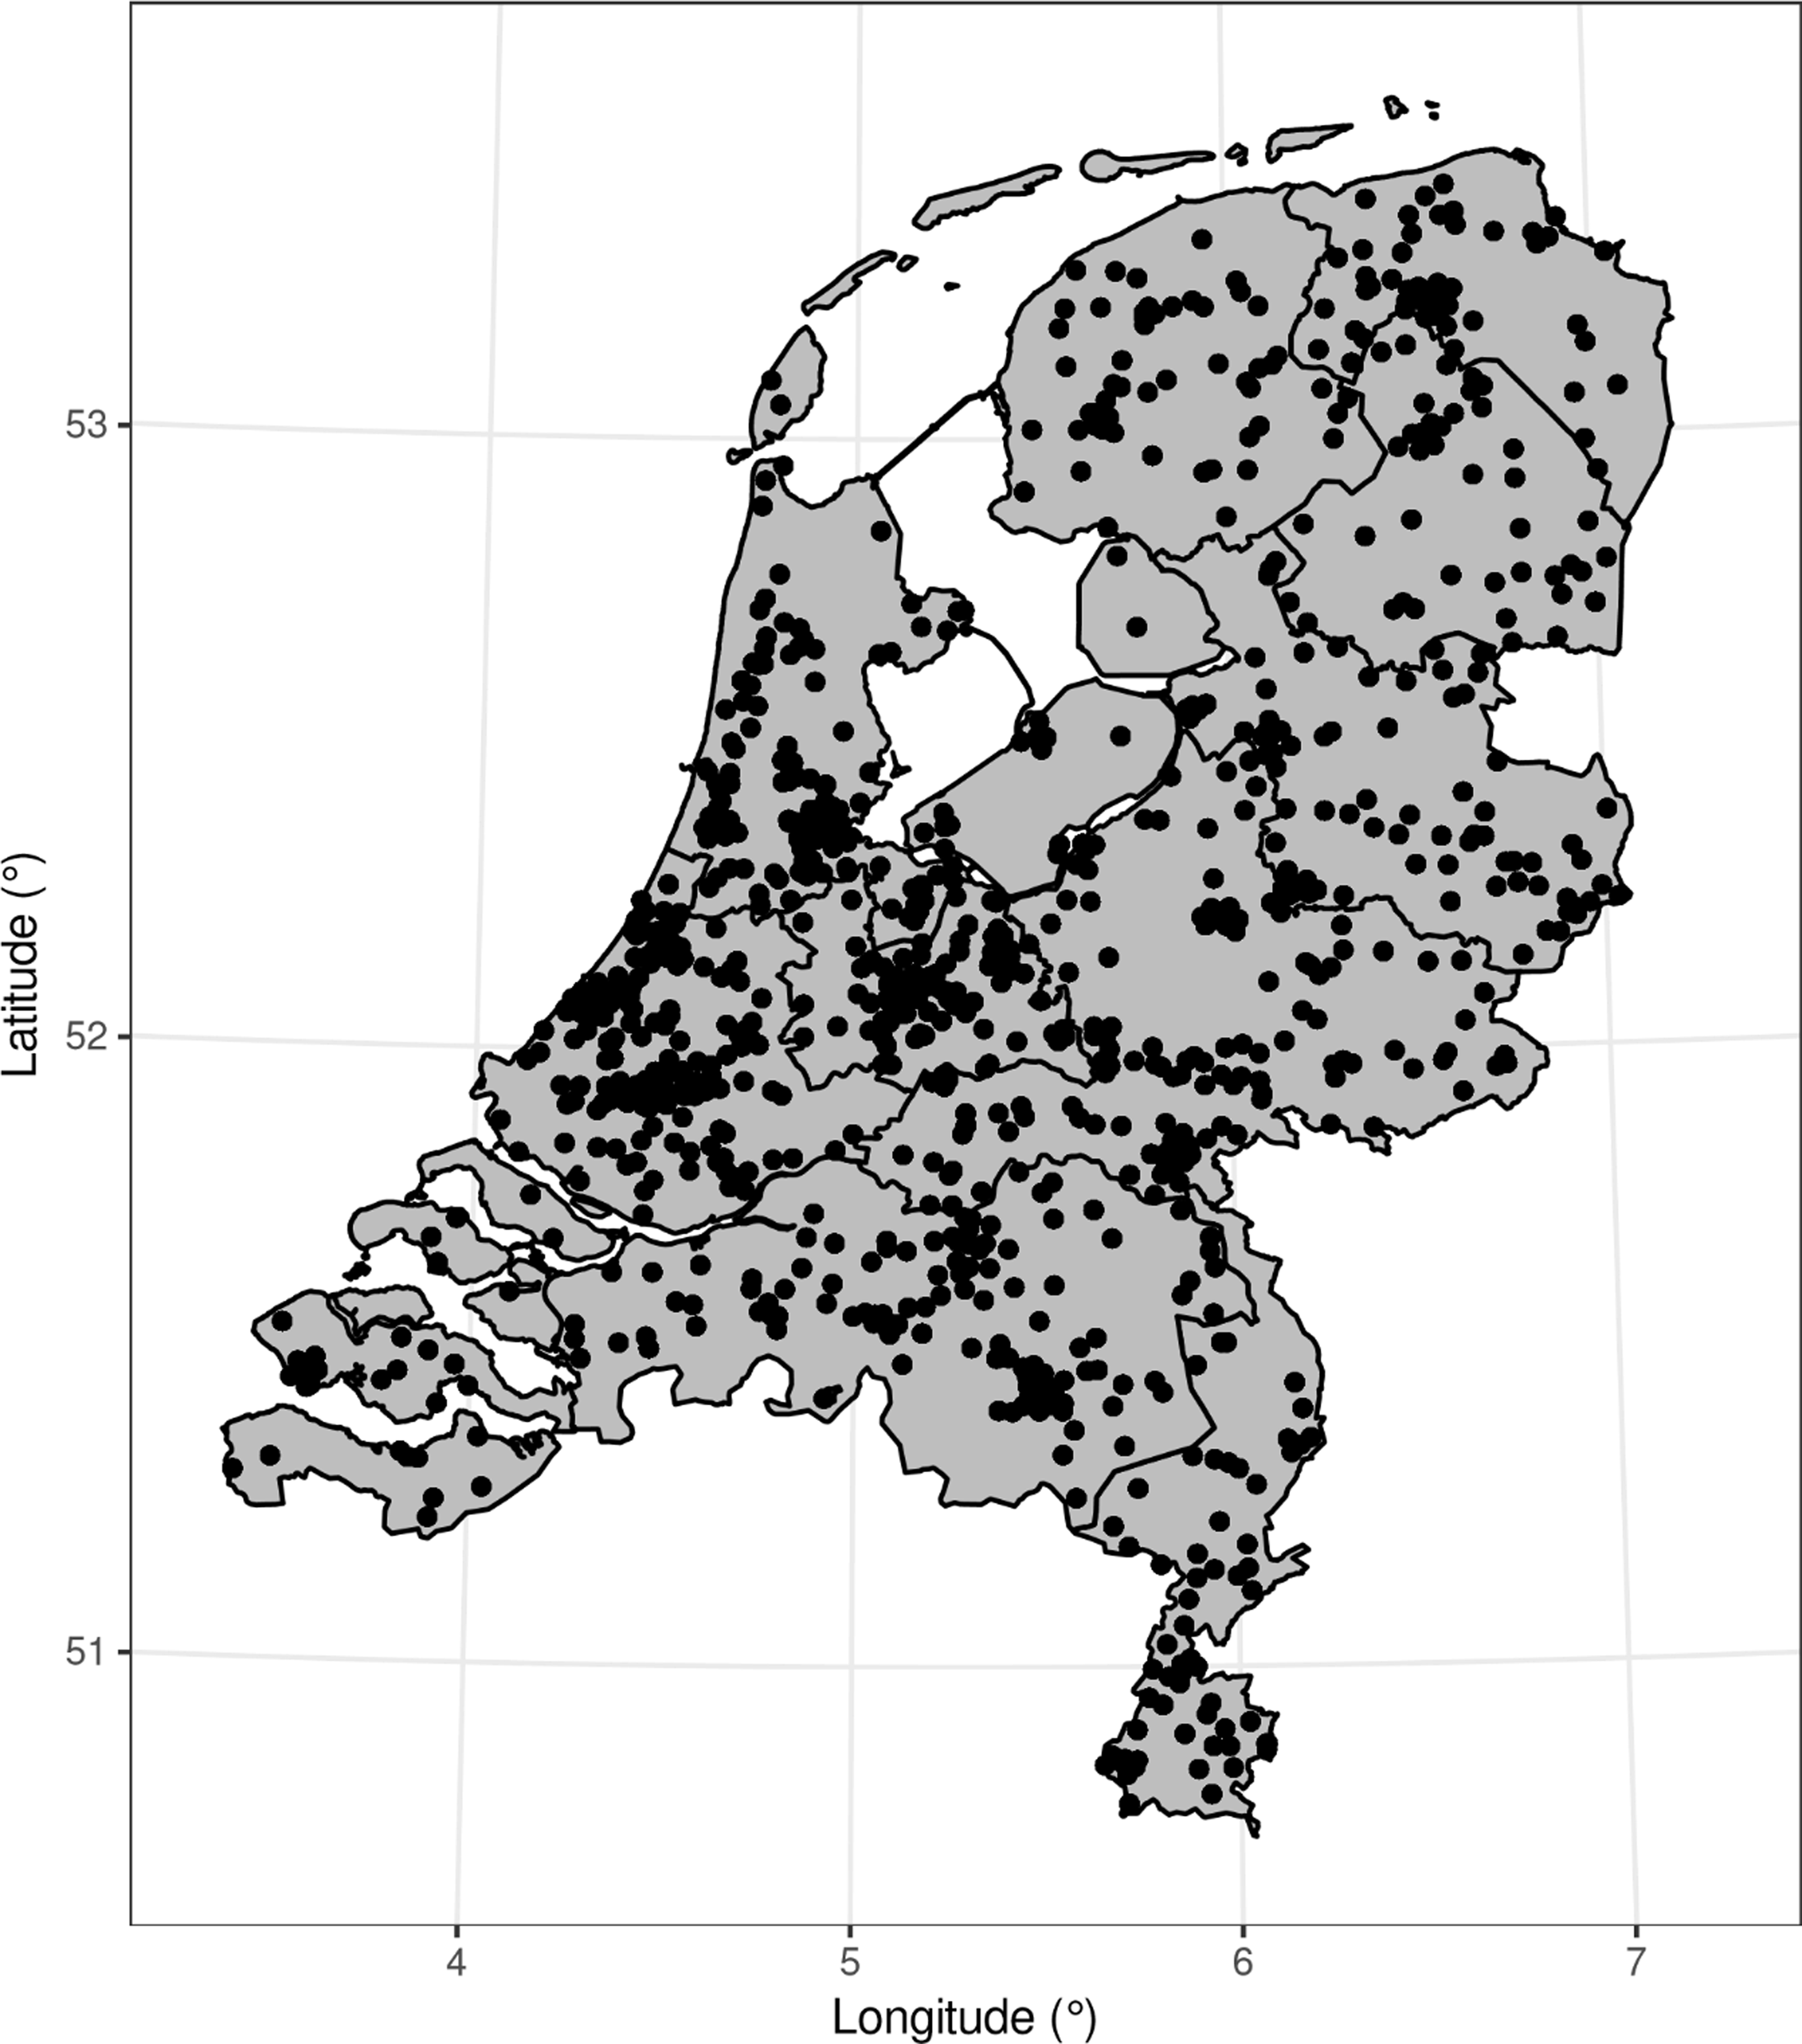
Map 2. Geographical origins of the listeners (i.e. the place where each listener has lived the longest). Each dot on the map of the Netherlands indicates the origin of (at least) one listener (n = 1,578). Black lines within the map indicate the borders of provinces.
The resulting data, as well as all analysis code used in this paper, are available at https://figshare.com/s/441a05c39b09fff3b3b4. The raw data are plotted in Map 3. To avoid crowding the map with too many individual dots, Map 3 bins the data along a 10×10-point two-dimensional grid of latitude and longitude values. The labels of the facets give the speakers’ true geographical origins, and the triangle indicates where that place is located on the map.
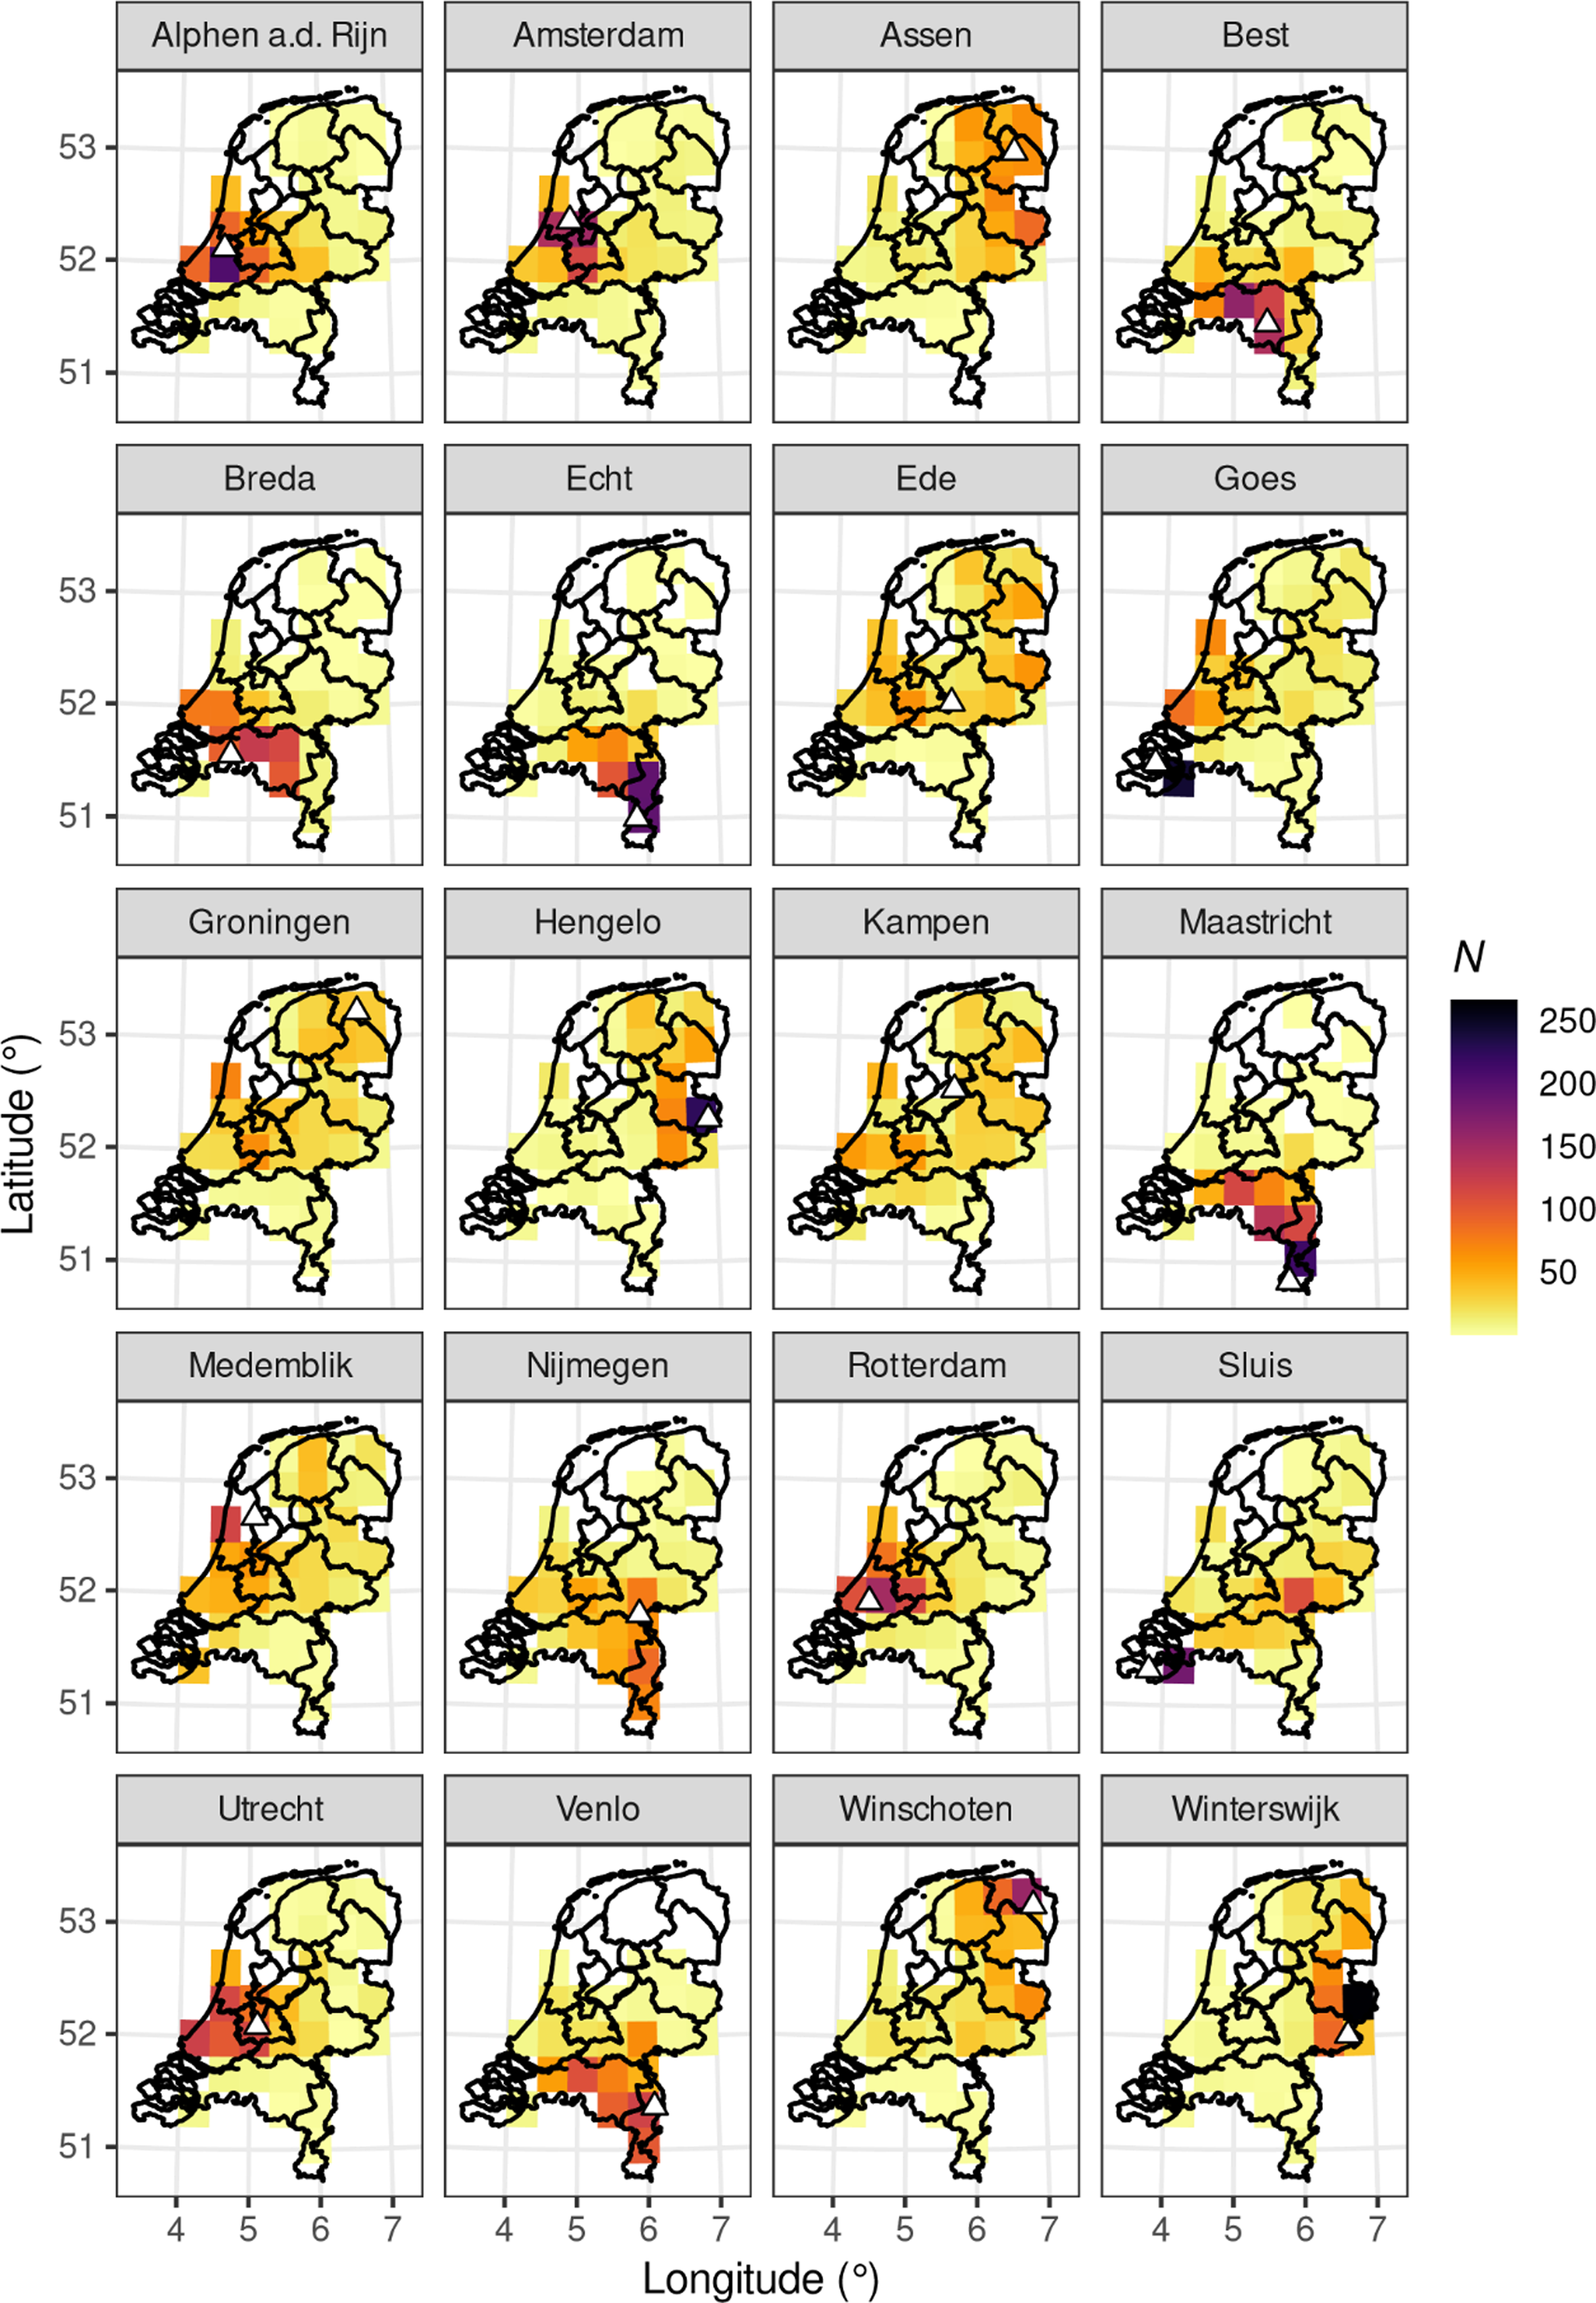
Map 3. Listeners’ perceived origins for the twenty speakers in our stimuli, binned along a 100×100-point grid spanning 4,116 points the Netherlands. Triangles indicate the true speaker origins, i.e. the locations of the sites in the facet labels.
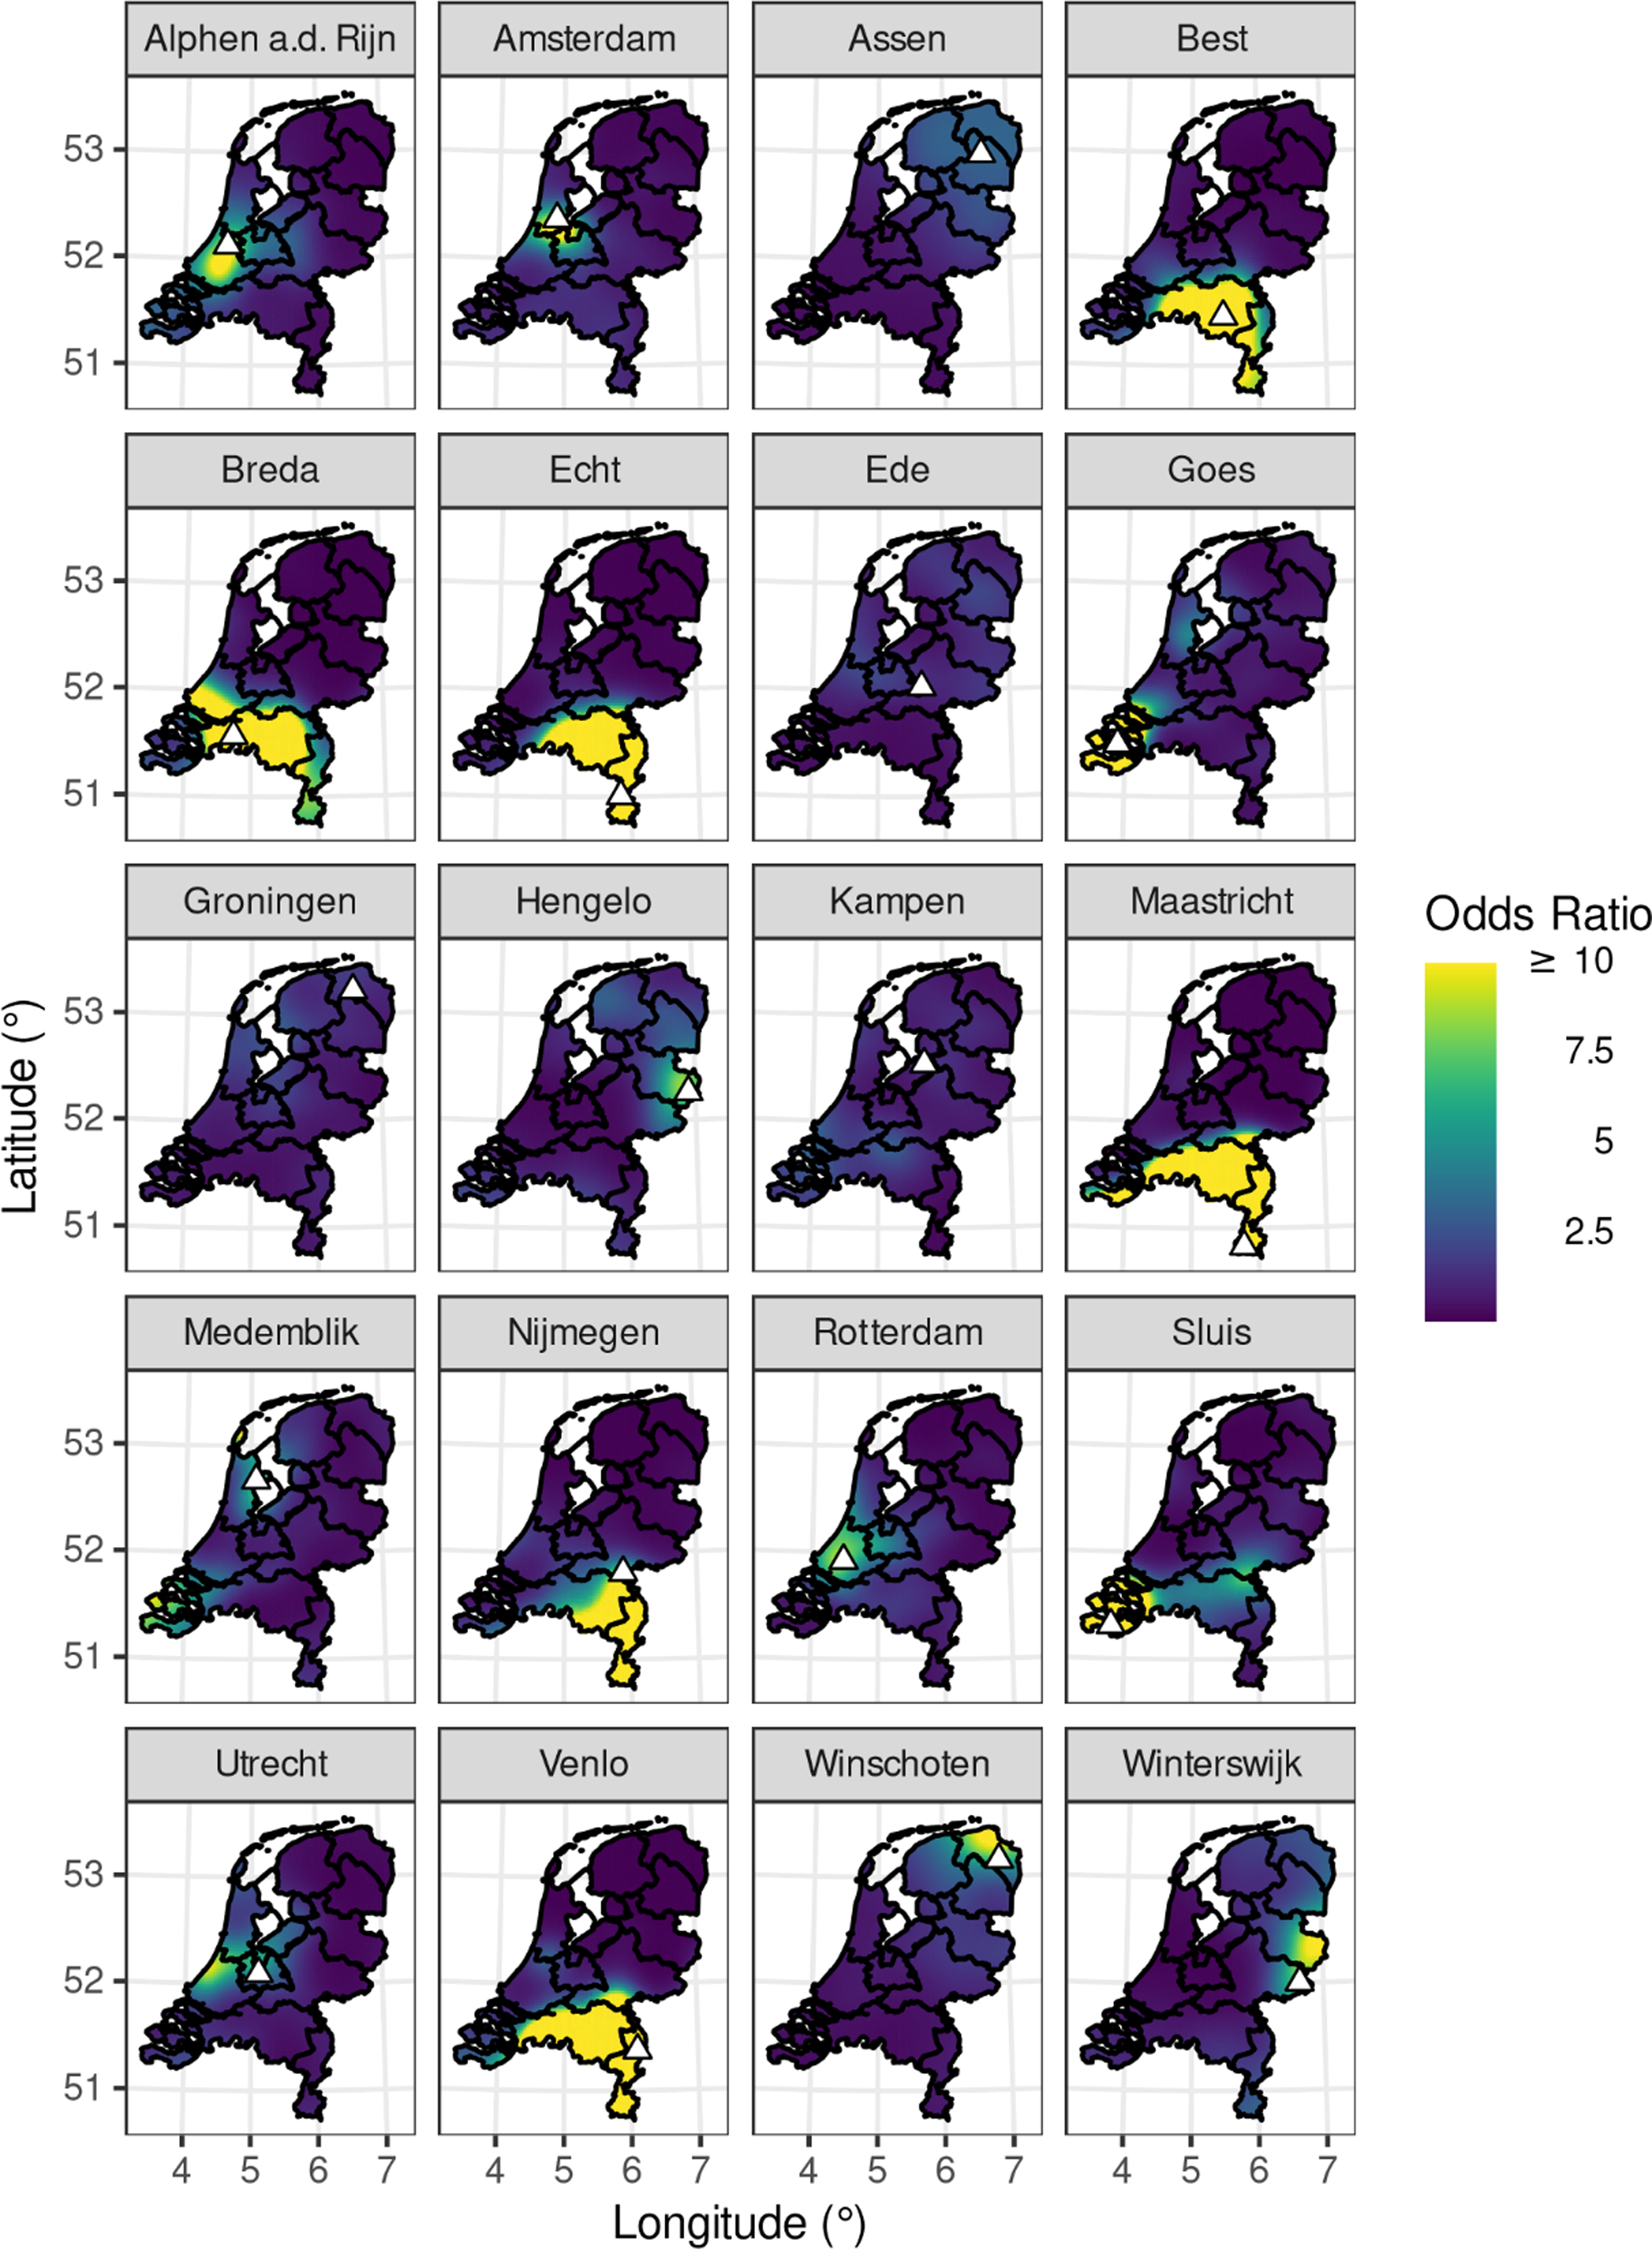
Map 4. Hotspots of regional associations identified by the Poisson model. Triangles indicate the true speaker origins, i.e. the locations of the sites in the facet labels.
Having discussed the nature of the map-based accent-recognition task and the way we implemented it, Sections 4 to 6 discuss quantitative analyses that aim to achieve the three remaining goals mentioned in the introduction: demonstrate the task, validate it, and draw new conclusions.
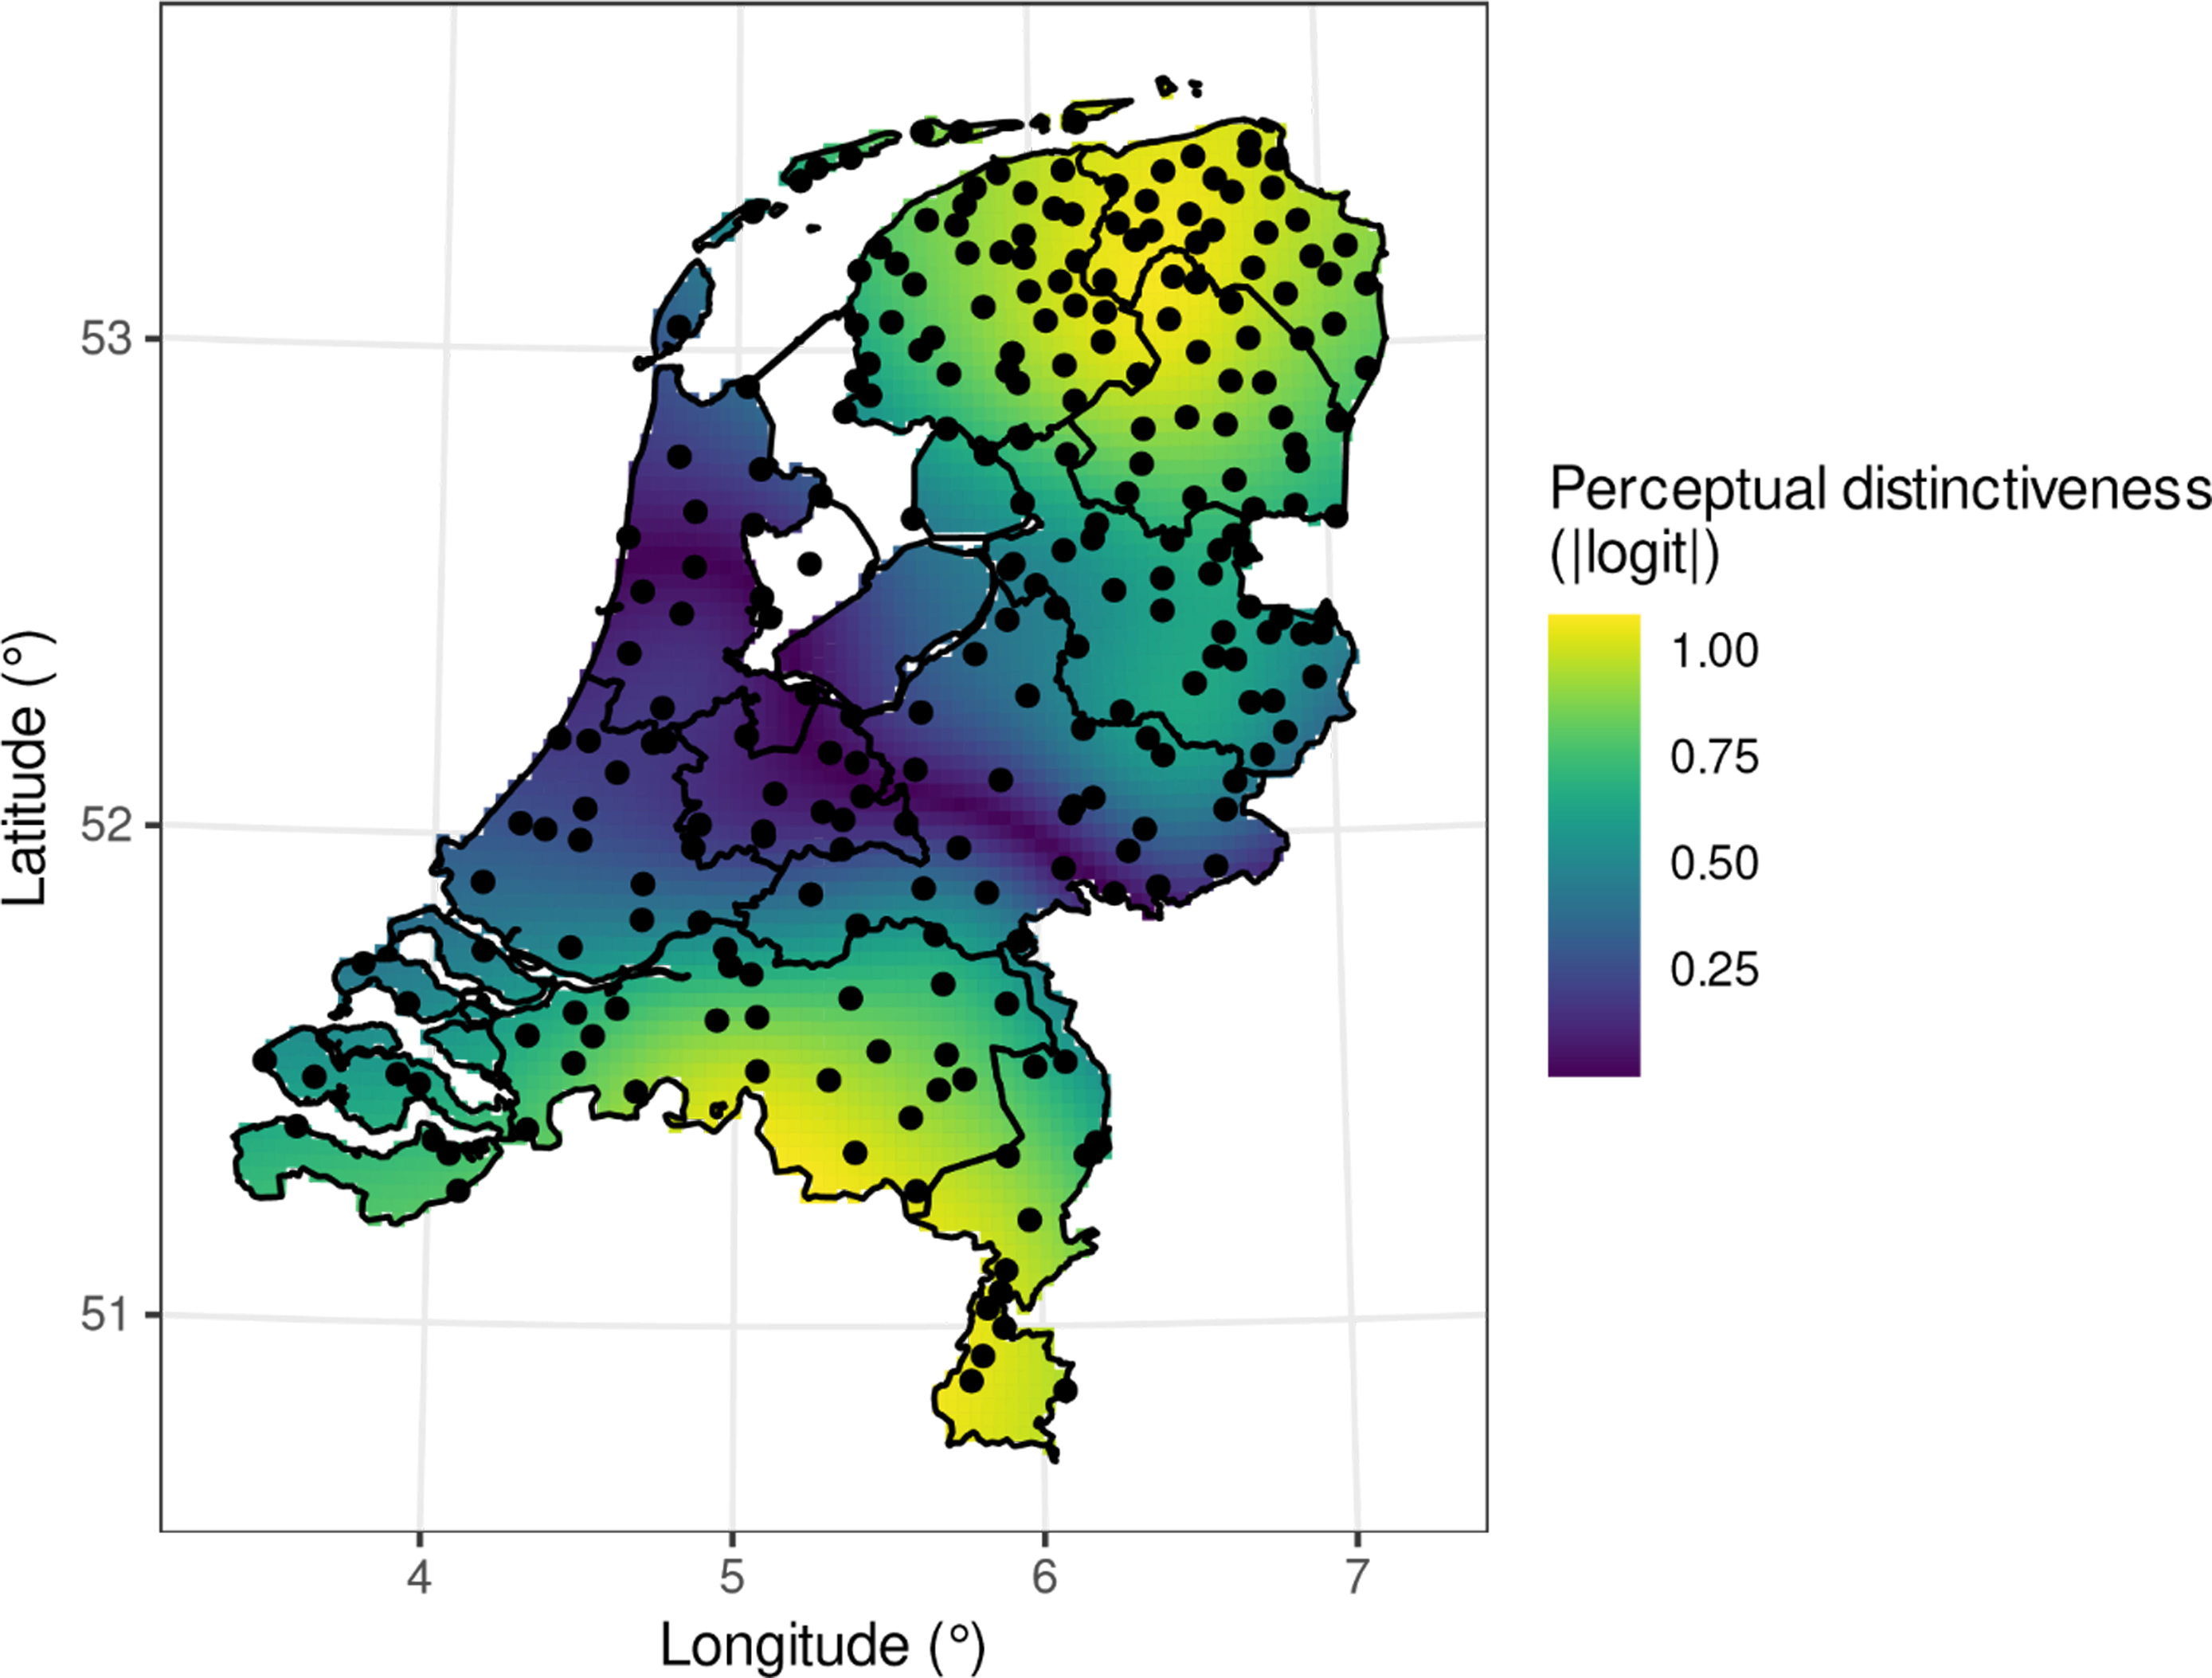
Map 5. The average perceptual distinctiveness of the entire map of the Netherlands, based on the results from the map-based accent-recognition task. Dots indicate the 257 places from Heeringa & Nerbonne (Reference Heeringa and Nerbonne2006), on which the correlation test is based.
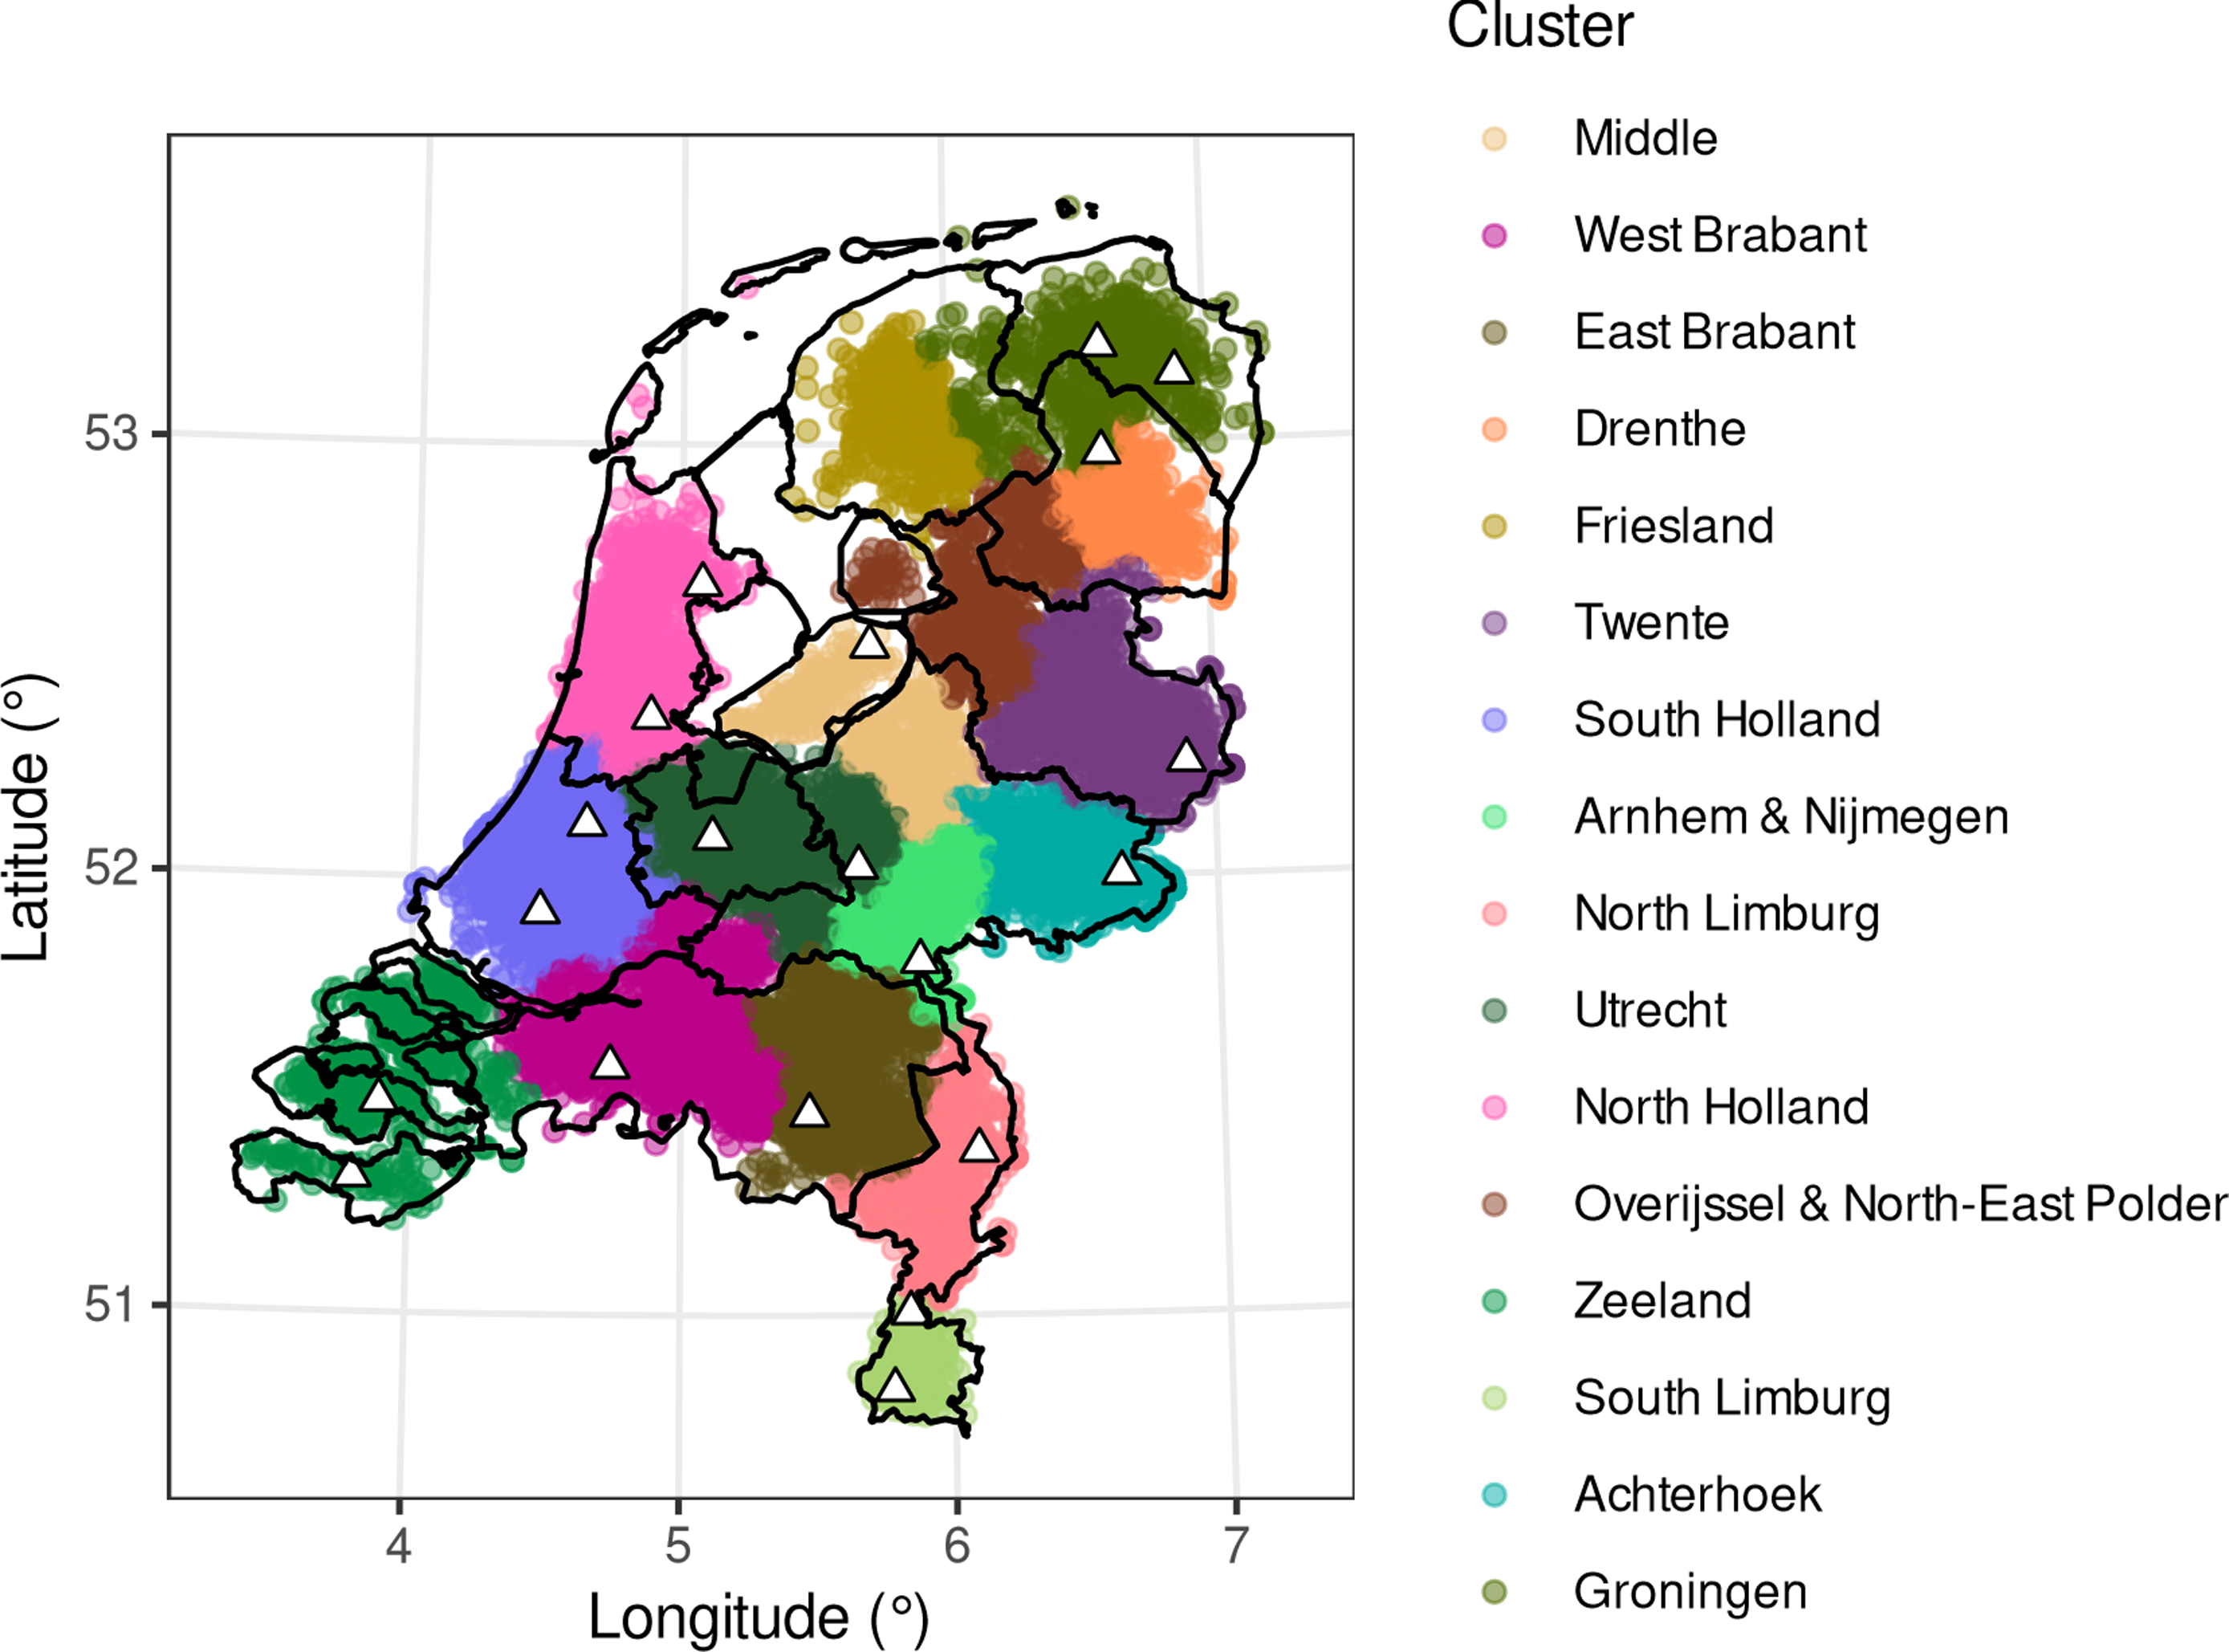
Map 6. Results of the hierarchical clustering analysis with 16 clusters. Each of the identified clusters has been given a separate color; these colors have no meaning otherwise. The names given to the clusters were attributed by the authors inspired by traditional dialectological groupings in the Dutch language area. They are thus the authors’ interpretation of what area these clusters roughly represent and only serve as descriptive labels. The triangles indicate the places of origin of the speakers in the map-based accent-recognition task.
4. Regional associations in perception
This section aims to demonstrate the perceptual associations that are elicited by the task. In this analysis, the aim is to examine the associations between speech and space. While we of course know where the speakers of these twenty accents specifically came from, we want to find out where the listeners think these accents should be localized.
4.1. Method
We investigated regional associations in perception by fitting the speakers’ true regions of origin on the basis of the listeners’ responses. We then investigated which parts of the map were significantly associated with these classifications. We constructed a classifier based on a multinomial logistic additive model, fitted via a surrogate Poisson modelFootnote 4 using the bam function from R package mgcv (Wood, Reference Wood2017). The dependent variable was the count of multinomial responses to each region. As predictors, we included a factor for “region” and—by each region—a spline on the sphere of the listeners’ clicks on the map in latitude and longitude coordinates. A spline on the sphere is a specialist tool for modeling <latitude, longitude> data, which is capable of modeling nonlinear effects occurring along the surface of a sphere. This contrasts with the straight lines assumed by traditional linear regression, which are not appropriate for geographical data. A first-derivative penalty was applied to prevent the spline from “curling up” at the edges of the map (i.e. incorrectly extrapolating beyond the borders, resulting in artifactual effects at the borders). To determine the form of the differences predicted by the model, i.e. to figure out where on the map regional associations were borne out, we divided the Netherlands into a 100×100-point grid and pruned away any points that lay outside the country, yielding 4,116 points. We then obtained the model’s predictions for these points for each of the twenty regions. Predictions were obtained on the logit scale.
4.2. Results
Map 4 visualizes the results of the analysis. For ease of interpretation, this map shows the predictions as odds ratios rather than as logits. Odds ratios have a natural interpretation as the change in odds relative to a true guess. Thus, if the speakers from Amsterdam yield an odds ratio of 10 at some point on the map, this means that listeners are ten times as likely to place those speakers at that point on the map, compared to them placing the speakers according to random chance.
The results show that some stimuli yielded very localized and accurate recognition patterns; for example, the fragments from Amsterdam and Winterswijk were recognized as coming from those specific places. More generally, however, and in concordance with Pinget, Rotteveel & Van de Velde (Reference Pinget, Rotteveel and Van de Velde2014), an overall picture emerges where sites in the northern, eastern, and southern periphery are more easily recognized and distinguished than sites from the so-called “middle” area (e.g. van der Harst, Reference Harst2011; Voeten, Reference Voeten2021b). Stimuli from these peripheral sites also positioned themselves most clearly along the sociolinguistic variables discussed in Section 3.2. Within these broad areas, listeners were not always able to distinguish differences between stimuli belonging to different towns. For example, listeners mostly thought that the speakers from Breda were from around Tilburg and Eindhoven, two other large cities located further east in the same province and dialect region. Similar imprecise recognition patterns were obtained for speakers from Nijmegen and Venlo, who were correctly identified as southeastern, but were not localized with further precision within this sizeable dialect area. Speakers from Winschoten were associated with Groningen, a much larger city that is very close by and is the socio-economic center of the eponymous province. Similarly, Alphen aan den Rijn is placed at the location of Rotterdam. These misidentifications correlate with geographical familiarity and distance: large cities will be familiar to more speakers than small towns, and it is more natural to confuse places that are close to one another than places that are far apart. However, such geographical factors cannot explain why these misidentifications were made and not others of equivalent distances, nor why some places group together at all (e.g. Nijmegen and Venlo are by no means close to each other, nor are they notably different in physical or population size, yet the listeners judged them to be in some way alike). These properties can be explained instead by appealing to the eight sociolinguistic variables mentioned in Section 3.2. For example, both the Groningen and the Winschoten fragments have the slightly nasal quality and slightly raised vowels that native listeners may associate with northern speech, and at sporadic points in fragments have a slightly syllabic /n/, which is a shibboleth for northern speech. As another example, the large accent area in the southeast of the country spanning Nijmegen through Maastricht is quite divergent on most of the discussed features, but is aligned on the two most salient features in the Netherlands: having velar pronunciations of (x) and having uvular pronunciations of (r).
This specific combination of these feature values is unique within this area of the country, and evidently also serves to delineate it in the judgments of our listeners.
4.3. Discussion
The results from this first analysis parallel the findings of prior studies investigating levels of categorization accuracy for speaker origin (e.g. Preston, Reference Preston1999; Bent et al., Reference Bent, Atagi, Akbik and Bonifield2016; Watanabe, Reference Watanabe2017; Gnevsheva, Reference Gnevsheva2018; Ruch, Reference Ruch2018; McKenzie et al., Reference McKenzie, Huang, Theng Ong and Snodin2019). Although adult listeners were shown to be generally able to identify speakers’ regional origins with reasonable accuracy, their accent-recognition patterns were imperfect. Similarly to prior studies, the major boundaries between the linguistic areas were perceived by most individuals. Yet, more subtle distinctions within these boundaries were made by listeners from specific regions. Clear periphery effects were revealed: the northern, eastern, and southern peripheries were easier to recognize than the western and central area of the country (commonly referred to as the “Randstad”).
These observations mirror those by Pinget, Rotteveel & Van de Velde’s (Reference Pinget, Rotteveel and Van de Velde2014) study of the recognizability of regionally accented Standard Dutch. Of the four broad regions included in their study (the Randstad, North, Middle, and South), their results showed that the southern and northern peripheries were strongly recognizable as such. Furthermore, they showed that the Randstad was recognized well only by listeners from that area (i.e. an effect of familiarity), while the dialectologically neutral Middle area had no such advantage to its recognizability.
It is important to ask to what extent these periphery effects are specific to the Netherlands. In the Netherlands, the Randstad area is the center of economic power, and the standard language has spread outward from this center (Wieling, Nerbonne & Baayen, Reference Wieling, Nerbonne and Harald Baayen2011). This makes the peripheral areas of the Netherlands the areas where regional accents are the most vivacious (in production) and perceptible (per Pinget, Rotteveel & Van de Velde, Reference Pinget, Rotteveel and Van de Velde2014). From the perspective of Schmidt’s (Reference Schmidt1872) wave model, these peripheral areas would be considered relic areas, resulting from the historical contingencies of the Netherlands as a country. However, if adopting a slightly different model, namely the gravity model by Trudgill (Reference Trudgill1974), this can be interpreted as a specific instance of the general pattern of a large, central, densely populated, economically important, prestigious area exerting a large amount of influence in particular on areas that are nearby, which naturally leaves only the (in this case, both geographically and socially) outer periphery as areas that were less strongly affected by this process of standardization. This interpretation is equally compatible with the obtained periphery effects, but it produces an additional prediction that these periphery effects should also be observed in other, comparable, language situations. We recommend that future research establish if our periphery effect is indeed an instance of such a general pattern.
Our present results reinforce the notion of a country-wide north–south distinction, as also described by Cornips (Reference Cornips2018). For many of our sites, recognition patterns were structured by the Great Rivers, which is often taken as the benchmark for the division between the dialectological north and south in the Netherlands. Many of the most salient sociolinguistic variables of Dutch come together at this boundary, with “the south” being well-known for, for example, its velar or even palatal realizations of (x) and its uvular realizations of (r). At least these two variables are well-known variables that come together at this major dialectological boundary. The salience of these variables also enables us to understand why a city like Nijmegen was grouped together with a city like Venlo. When listening to the stimulus fragments side by side, the two cities are very distinct, and to a linguist it may be surprising that these two cities could be mistaken for one another—for example, the intonation contours of the Venlo speakers (especially the female one) subjectively sound very much like those typical for the province of Limburg (Venlo’s province), while this cannot be said of the Nijmegen fragments (and Nijmegen indeed is located in a different province). However, the four Nijmegen and Venlo fragments do match on these two major variants of (x) and (r). We interpret this as demonstrating that these two variables are so salient that the finer divisions may simply be felt to matter not as much, to our complete sample of listeners as a whole. It would be interesting for future research to focus on the subset of listeners who were specifically from the Nijmegen–Venlo area, who might perhaps have been more sensitive to the finer details beyond these two major country-wide variables.
The example of Nijmegen and Venlo is representative of the general picture: while the mentioned broad pattern of north vs. south was well-established, recognition at a more fine-grained level was rather inaccurate. This is reflected particularly well in the southern and southeastern areas, which are excellently recognized as a whole, but cannot be seen to be subdivided further. In addition, listeners tended to erroneously associate rural speakers with neighboring larger urban areas. This reflects the aforementioned familiarity effect observed by Pinget, Rotteveel & Van de Velde (Reference Pinget, Rotteveel and Van de Velde2014): listeners are probably more familiar with big cities than with small villages. To summarize, these findings support the general claim by Plichta & Preston (Reference Plichta and Preston2005) that listeners represent regional variation only in a broad manner.
5. Relating perception to production
The third aim of this study is to establish the validity of the map-based accent-recognition task. This will be achieved by relating the obtained perceptual data to the well-studied dialectological patterns of variation in production. There is ample evidence that perception and production correlate in general (e.g. Voeten, Reference Voeten2021a), including in the specific case of map-based tasks. A particularly relevant study is that of Benson (Reference Benson2003), who compared dialectometric production data with evidence from a draw-a-map task. Benson (Reference Benson2003) showed that the synchronic perceptual boundaries largely, but nowhere near completely, correlated with the dialectometric boundaries that had, of course, come about through years of diachronic development. Where they coincide, Benson (Reference Benson2003) argues that the two types of boundary reflect differences that are particularly salient and that bear on the respective listeners’ desires to maintain distinct identities. In sum, production data obtained through dialectometry and perception data obtained through map-based tasks measure different aspects of the same historically developed language continuum. Thus, at least for purposes of the present paper, we expect them to correlate (due to both measuring sociogeographical variation in speech), but not necessarily very strongly (due to measuring different aspects thereof). The present section investigates this correlation for our dataset, using dialectometric data for production that are based on Levenshtein distances. Previous research by Wieling et al. (Reference Wieling, Jelke Bloem, Timmermeister and Nerbonne2014) has already demonstrated that Levenshtein distance in production correlates with perceived distance in perception.
As a reference for the production patterns, we use the geographically comprehensive dialectometric corpus by Heeringa & Nerbonne (Reference Heeringa and Nerbonne2006). Recall from Section 3.1 that this variation among dialects formed the historical basis for the present-day regional variation in Standard Dutch with an accent. For this reason, even though Heeringa & Nerbonne’s dialectometric data is not perfectly commensurate with our data on regional variation in Standard Dutch, there should be at least a degree of overlap between the two. We measure this, and thereby establish the convergent validity of the map-based accent-recognition task, by correlating distances in perception (which will be based on our data) with distances in production (based on Heeringa & Nerbonne). There is ample literature on the Dutch dialect continuum establishing that such a correlation exists between perception and production (e.g. Pinget, Rotteveel & Van de Velde, Reference Pinget, Rotteveel and Van de Velde2014; Pinget, Reference Pinget2015; Voeten, Reference Voeten2021a,b), and given the relationship between regional dialects and Standard Dutch with an accent, our task should produce this too.
5.1. Method
In Section 5.1.1 we describe the corpus of Heeringa & Nerbonne’s production data and provide details on their measure of linguistic distance. Then Section 5.1.2 describes how the results from the map-based accent-recognition task were operationalized in terms of perceptual distinctiveness, such that they can be compared to the production distances. Section 5.1.3 explains how we related these two measures to each other, thereby testing the relationship between regional differences in production and in perception.
5.1.1. The production data
Integrating multiple Dutch dialect atlases into a single dataset, Heeringa & Nerbonne (Reference Heeringa and Nerbonne2006) computed phonetic distances between 361 places in the Netherlands and Flanders.Footnote 5 Of these places, 257 are located in the Netherlands, and are hence useful complementary data to our perception study. The remaining Flemish places are left out of consideration here. For a visual overview of the 257 Netherlandic places, refer to Map 5 in Section 5.1.2, which provides a combined plot of these places and their perceptual distinctiveness as borne out by our task. The original dataset by Heeringa & Nerbonne (Reference Heeringa and Nerbonne2006) is based on the Reeks Nederlandse Dialectatlassen (“Compilation of Dutch dialect atlases”) by Edgard Blancquaert and Willem Pée. The dataset consists of 139 sentences of 1,956 local dialects each, based on texts from 1922–1975. From these, 360 local dialects were selected, and 166 representative words suitable for comparison across these dialects. Heeringa & Nerbonne (Reference Heeringa and Nerbonne2006) computed pronunciation distances between all of these words using the Levenshtein distance (Levenshtein, Reference Levenshtein1966; sometimes also known as “edit distance”). This is a measure that compares phoneme alignments of cognates taken from different dialect areas. We refer to Heeringa (Reference Heeringa2004) for an extensive overview of its application in Dutch dialectology. Since their 2006 publication, an improved form of Levenshtein’s distance has been formulated known as “PMI-Levenshtein” (Wieling, Margaretha & Nerbonne, Reference Wieling, Margaretha and Nerbonne2012). Rather than treating every insertion, deletion, or substitution as an equally costly operation, PMI-Levenshtein computes the cost of these operations based on the involved sounds’ pointwise mutual information (Church & Hanks, Reference Church and Hanks1990). Taking substitutions as an example, this means that a substitution of, for example, /ɪ/ to /ϵ/ is considered less expensive than a substitution of /ɪ/ to /aː/, a phonologically more distant sound. Thus, rather than assigning a fixed cost of 1 to each edit operation, PMI-Levenshtein computes fractional weights that represent the markedness of a given operation, given the data. These weights are computed from the data using the following equation:
 $${\rm{cost}} = {\log _2}\left( {{{p(x,y)} \over {p(x)p(y)}}} \right),$$
where p(x) and p(y) are the probabilities of encountering the phonemes x and y at all, and p(x,y) is the probability of x and y being aligned together. High values for p(x,y) indicate a high probability of x and y being each other’s counterpart across the 257 dialect areas in our subset of the data. The denominator p(x)p(y) serves to normalize these cooccurrence probabilities by the probabilities of encountering both sounds at all.
The linguistic distances in production are represented using these improved PMI-Levenshtein distances between the 257 places in our subset of the Heeringa & Nerbonne data. To compute the 257×257 distance matrix, we used the PMI-Levenshtein implementation in LED-A (Heeringa, van Heuven & Van de Velde, Reference Heeringa, van Heuven and Van de Velde2022).Footnote 6
5.1.2. The perception data
The Poisson model from Section 4 resulted in twenty maps of associations between accents and geographical space. It is possible to overlay the 257 places from the Heeringa & Nerbonne (Reference Heeringa and Nerbonne2006) data onto each of these maps. This provides a measure of the extent to which the twenty accent types in our data are linked to those 257 places. We call this measure a perceptual association, of our twenty accents to Heeringa & Nerbonne’s (Reference Heeringa and Nerbonne2006) 257 places.
On the logit scale, where these perceptual associations are linear, the (absolute) difference between two places’ perceptual associations represent a measure of their perceptual distance. The average of the twenty perceptual distances that we can compute in this way, we call perceptual distinctiveness.
We computed the perceptual distinctiveness for each of the 257 places in the Heeringa & Nerbonne data, as well as for the 4,116-point grid we used to visualize our data in Map 4. The latter enables us to visualize a map of the perceptual distinctiveness (based on the twenty accents in our data) for the entire country; see Map 5. However, we focus our investigation now on the perceptual distinctiveness of the Heeringa & Nerbonne places. To enable this to be compared to Heeringa & Nerbonne’s Levenshtein distances, we arranged our perceptual-distinctiveness values into a 257× 257 distance matrix. This gives the differences in perceptual distinctiveness for each of the 257 Heeringa & Nerbonne places to each of the others.
5.1.3. The Mantel test
The next step is to relate the production distances (Section 5.1.1) to the perception distances (Section 5.1.2). We do this using a correlation test specific to distance matrices, called the Mantel test (Mantel, Reference Mantel1967). This is a nonparametric test that works on the basis of a permutation test. More specifically, the observed correlation between the two distance matrices’ elements is compared to an expected correlation (under H0), which is derived empirically by randomly permuting one of the two matrices a large number of times. Under this random permutation, there will be no true correlation between the two matrices; randomizing a large number of times establishes a distribution of correlation coefficients under this H0. The observed correlation statistic (i.e. on the non-randomized data) is then compared against these expected correlation coefficients, allowing the computation of a p-value corresponding to the proportion of randomized correlations that rejected the H0 of no association by pure chance. We refer to Heeringa (Reference Heeringa2004) for more details. We implemented our correlation test between the production and perception data using the mantel function from R package vegan, using 1,000 permutations (a suitable number for α = .05; Manly, Reference Manly1997).
5.2. Results
The correlation between the phonetic production distances and our measure of perceptual distinctiveness amounted to r = .50. Thus there is a linear association of .50 between our listener-based measure of perceptual distinctiveness and Heeringa & Nerbonne’s (Reference Heeringa and Nerbonne2006) objective dialect distances. The correlation was significant, with p < .001. This means that 25% of the variance in production can be explained by the variance in perception, and vice versa.
5.3. Discussion
Results by Wieling et al. (Reference Wieling, Jelke Bloem, Timmermeister and Nerbonne2014) had already established that PMI-Levenshtein distance is significantly correlated with variation in perception. By showing that the same PMI-Levenshtein distance also correlates with our measure of perceptual distinctiveness, our significant correlation of r = .50 demonstrates that the map-based accent-recognition task has indeed measured a component of sociolinguistic distance in perception. This argues in favor of the task’s validity. Moreover, the correlation is in the expected, positive, direction: a higher distance in production yields a higher distinctiveness in perception. Thus, beyond the aforementioned methodological point, the correlation argues that the task is valid from the perspective of sociolinguistics: our results in perception partially reproduce, and hence are convergently valid with, independently attested sociolinguistic differences in production.
While the point of primary importance is the observation that the correlation is statistically significant, some further reflection is warranted on its magnitude of .50. There are two important differences between our data and those by Heeringa & Nerbonne (Reference Heeringa and Nerbonne2006). The first concerns the object of study: dialects (Heeringa & Nerbonne) vs. Standard Dutch with an accent (our data). The second is, of course, the type of data: production vs. perception. We were able to make this comparison because we know that dialects are correlated with Standard Dutch with an accent (they formed the basis for it; Section 3.1) and that production is correlated with perception in the Dutch language continuum (Pinget, Rotteveel & Van de Velde, Reference Pinget, Rotteveel and Van de Velde2014; Pinget, Reference Pinget2015; Voeten, Reference Voeten2021a,b) and in map-based accent-recognition tasks (cf. Benson, Reference Benson2003). Our significant correlation establishes the logical next step: that these correlations combine. That they do not do so perfectly, but rather only account for 25% of the variation in the data, is a promising sign: we believe this to be small enough to be realistic in light of the previously mentioned differences, yet large enough to be substantively relevant.
Beyond these implications for the task’s validity, the observed perceptual-distinctiveness values are relevant reflections of the sociophonetic landscape of the Netherlands in and of themselves. The observed differences in perceptual distinctiveness in Map 5 follow a well-known north–south pattern in Netherlandic accents. The southernmost edges of the map (particularly the provinces of Brabant and Limburg) have a high perceptual distinctiveness, as does the northernmost edge of the map (the provinces of Groningen and Friesland). The lowest perceptual distinctiveness is observed for the Randstad areas in the west of the country (particularly the provinces of North Holland, Utrecht, Flevoland). The Randstad area is the area that is commonly associated with the standard language (cf. Van de Velde, Reference Van de Velde1996; Van de Velde & Houtermans, Reference Van de Velde, Houtermans, Huls and Weltens1999). It then follows naturally that, contrary to the peripheral areas in which regional accents are more marked, the Randstad area indeed is less perceptually distinctive. The Randstad is joined in its low perceptual distinctiveness by the area known as the “Middle,” which is commonly identified (in production studies) as having a particularly neutral regional accent (van Hout et al., Reference Van de Velde, Houtermans, Huls and Weltens1999; van der Harst, Reference Harst2011). This north–south pattern around the Randstad and Middle reinforces the same distinction found in the analysis from Section 4 and the results by Pinget, Rotteveel & Van de Velde (Reference Pinget, Rotteveel and Van de Velde2014) (see Section 4.3 for discussion). It is additionally reproduced in our previous analysis of listeners’ accent-recognition errors (Pinget & Voeten, Reference Pinget and Voeten2023). As in these three sets of results, the degrees of perceptual distinctiveness in Map 5 are structured by the Great Rivers, an important stereotype delineating regional accents in Standard Dutch. The map reflects this by a strip of very low perceptual distinctiveness running roughly diagonally through the country: this perceptual boundary coincides with the geographical boundary formed by the Great Rivers. Thus, Map 5 reproduces both the known markedness of the north and south periphery and the known unmarkedness of the Randstad and Middle areas.
6. Finding perceptual isoglosses
The fourth goal of the present paper is to draw new conclusions on the Dutch accent landscape. Pinget & Voeten (Reference Pinget and Voeten2023) showed that, at least at the group level, all twenty accents were recognized relatively well. The present section examines to what extent these accents are actually distinguished from each other, and whether there are clear perceptual isoglosses that delineate the different accents.
Traditionally, isoglosses are defined as lines on a map representing an objective, geographical boundary for a certain linguistic feature. A bundle of isoglosses is required to justify major and minor dialect boundaries as a spatially contiguous area on the map. In the case of perceptual isoglosses, the relevant linguistic features are not the objectively measured differences in production language data, but rather the fact that a particular regional accent is subjectively associated with a particular place on the map. Given the data from the map-based accent-recognition task, in which regional accent was the key factor being manipulated, we can derive perceptual isoglosses empirically by means of a cluster analysis of the clicks in these data.
6.1. Method
Perceptual isoglosses were established by means of hierarchical cluster analysis, using R’s hclust function (R Core Team, 2023) with Ward’s distance criterion. This criterion maximizes the between-cluster variance and minimizes the within-cluster variance (Murtagh & Legendre, Reference Murtagh and Legendre2014). The input to the analysis was a 15,780×15,780 distance matrix of each click to all other clicks (computed using the haversine function from R package pracma; Borchers, Reference Borchers2021). This cluster analysis did not need to be stratified by the regional origins of the speakers presented to the listeners, as we are not looking for accent-specific isoglosses but are rather looking for the general recognition patterns over the country as a whole. Because listeners were explicitly made aware that the nature of the task was to identify the speakers’ regional origins by their accents, an analysis of the individual clicks provides this information directly.
To determine how many clusters should be distinguished to adequately represent the data, the cutree function was used to cut the tree so as to yield 2 to 50 distinct clusters. For each of these 49 reduced trees, the silhouette statistic was computed using the silhouette function from R package cluster. The tree with the highest silhouette statistic represents the data in the most optimal way.
6.2. Results
The highest silhouette statistic, and hence the optimal partitioning of the data, was obtained for k = 16 clusters. Map 6 plots the resulting geographical partitioning.
One feature of Map 6 that immediately jumps out is that the resulting clusters largely approximated the Dutch province boundaries. However, there are some dialectologically important deviations. First, the province of Brabant is split up into two parts, an east side and a west side, which reproduces the same division from dialectological research. Limburg is carved up into a northern and a southern part, again reproducing well-understood regional dialectology of this variety (see also Cornips, Reference Cornips2018). The province of Gelderland is carved up into a few distinct accents. As one might expect, one of these divisions is of the Achterhoek, a dialectologically strongly marked subregion of Gelderland. In our stimuli, the single town in the Achterhoek is Winterswijk; notable differences from the rest of Gelderland involve vowels being realized more closed and a somewhat nasal speech quality, realized final /n/ in noun plurals and verb infinitives, and the alveolar (r). All of these features are noticeably stronger in the female speaker than in the male speaker. Other parts of Gelderland are pulled together with the neighboring areas of West Brabant, East Brabant, Utrecht, and Flevoland (for which reason we refer to this combined area as “Middle” as in Pinget, Rotteveel & Van de Velde, Reference Pinget, Rotteveel and Van de Velde2014). Additionally, there is also a province-internal split-off consisting of the area around Nijmegen and Arnhem, which again share known local regional-accent features; Nijmegen is notable for having velar realizations of (x) and uvular fricative realizations of (r). Similarly to the Achterhoek, the province of Overijssel is split up into a “main” part and the part consisting of Twente, another dialectologically distinct area; the relevant town in our stimuli is Hengelo, which differs from the rest by its overall prosody, its notably low realization of (ϵi), and perhaps most relevantly, the realization of coda /r/ as [ɐ]. Finally, one of the clusters corresponds to Friesland, even though there was no speaker from this region in the stimulus materials.
6.3. Discussion
The results from the cluster analysis showed that the perceptual isoglosses of Netherlandic Standard Dutch loosely mirror the province boundaries, but with dialectologically motivated differences. That is, when a naïve listener is asked to place someone’s accent, the level of representation at which they do so is the province level. However, the results showed that the province level is not absolute, but is further subcategorized for those accent areas for which it makes sense dialectologically, as in the noticeably different accent regions of Gelderland, for example. This observation is not fully compatible with an account of an accent-placement strategy by which listeners make conscious use of the provided province boundaries, and hence cannot be explained as being an artifact of the task’s use of Google Maps. Instead, this pattern of accent placement shows that the accent-recognition task is able to tap into implicit sociolinguistic knowledge of local features that make a given area distinct. While not all individuals necessarily have knowledge of these individual features, the 1,578 listeners did demonstrate collective knowledge of the important characteristics differentiating, for example, the Achterhoek from the rest of Gelderland.
This further establishes the validity of the map-based task, and provides new insights into the perceptual dialect continuum of the Netherlands, going beyond earlier approaches such as the little-arrow method (applied to Brabantish dialects by Weijnen, Reference Weijnen1946) or the draw-a-map task (applied to Limburgian dialects by Cornips, Reference Cornips2018). The analysis informs us about the strategy by which listeners have placed their clicks on the map. The task turned out to probe an intermediary level of sociolinguistic knowledge, which provides a positive contribution to the validation of the map-based accent-recognition task.
The described perceptual isoglosses necessarily reflect collective sociolinguistic knowledge, and cannot be a simple reflection of the specific characteristics of the stimulus materials. This is shown by the fact that the listeners even identify accent areas from which no speaker was present in the stimulus materials, such as the province of Friesland. Evidently, the Frisian accent in Dutch is sufficiently salient as a separate sociolinguistic entity, in the minds of a sufficiently large number of listeners, for it to be borne out as its own cluster area in the task. This underscores that the map-based accent-recognition task really probes subjective perceptual evaluations.
The strikingly detailed picture painted from a dialectological perspective also suggests that region-specific knowledge at least partly contributes to the global patterns of dialect boundaries that emerge from the data. That is, while the 1,578 listeners’ regional origins were distributed relatively homogeneously over the whole language area, it is reasonable to assume that the precise boundary between, for example, East and West Brabant has been contributed by listeners familiar with the distinction between these (sub)varieties of Brabantish Dutch. We believe that for such local associations to be sufficiently robust to be borne out in the country-wide cluster analysis reported in Map 6, they must be held by a sufficient number of listeners as well as be sufficiently strong. This predicts that the emergence of such features is related to their indexical salience, i.e. their status as marker, indicator, or stereotype. The notion of salience could also be invoked to explain why, of the many possible features of the different accents of Dutch, it is specifically these accents that are delineated by them in our dataset. Future research should investigate the role of sociolinguistic salience in the geographical partitioning of dialect boundaries directly.
7. General discussion
The goals of the present paper were to introduce the map-based accent-recognition task, demonstrate its use, validate it, and generate new conclusions about the Dutch language situation in the Netherlands. In Section 3, the task was demonstrated to yield accent placements from a large number of Dutch listeners. In the later sections, we have demonstrated various perspectives on the resulting data. Within this context, there are a few issues that we believe bear some reflection. We discuss these next.
7.1. The type of knowledge tapped by the task
The results from Section 4 revealed that, broadly speaking, listeners were able to place speakers at approximately the right locations on the map. This shows that listeners are making use of their sociolinguistic knowledge about the speakers’ regional origins, but that this knowledge is rather imprecise. It appears to follow larger perceptual categorizations (e.g. separating the north and the south of the Great Rivers, but lacking finer detail; cf. Plichta & Preston, Reference Plichta and Preston2005) along the same lines as previously identified by Pinget, Rotteveel & Van de Velde (Reference Pinget, Rotteveel and Van de Velde2014). Section 5 showed that this north–south division is one especially clear instance of a more general periphery effect. The three peripheries were more perceptually distinct than the neutral Middle. Finally, Section 6 mapped out the listeners’ perceptual isoglosses by clustering the data and showing which areas of the map turned out to constitute homogeneous areas. The analysis recovered most province boundaries, but also showed that some of the provinces had been further subdivided in reflection of the isoglosses important to dialectological boundaries. This parallels the findings in Preston (Reference Preston1989a:25), who already claimed that state lines or other historical–political boundaries have a significant effect on participants’ perceptual isoglosses.
So far, these findings are amenable to two types of interpretation. The first is that listeners have direct associations between accents and areas, but that these associations are rather sloppy, perhaps due to imperfect knowledge of areal or linguistic geography. In this interpretation, listeners use broad linguistic and areal features as a clutch to enable them to do the task. In the second type of interpretation, listeners have indirect associations between accents and areas, these being mediated by sociolinguistic representations. We believe that both types of interpretation are necessary to explain the data.
In a different analysis of the same dataset (Pinget & Voeten, Reference Pinget and Voeten2023), we showed that there are various factors that affect the accuracy with which listeners are able to place accents on a map. Among these were listeners’ level of education, geographical knowledge, place of longest residence, and distance to their own region. These effects were in the expected directions: higher-educated listeners were better at placing accents than lower-educated listeners (though this effect was not a smooth line over the different education levels in our data), more geographically knowledgeable listeners did better than less knowledgeable listeners, and listeners were more precise at localizing accents closer to their own region and the region where they had lived the longest than they were at placing accents that were farther away. Relatedly, cities were recognized better than villages; this follows from the aforementioned familiarity effect, given that listeners from cities were more strongly represented in our sample (analogously to cities’ increased population density to villages), but may additionally be due to every listener being more familiar with cities than villages overall. With some individuals being better than others (both in general and for specific accents), the global view over the 1,578 listeners presented here necessarily smooths out these individual differences, leaving only the general patterns for the current analyses. We note that this immediately opens up a logical avenue for future research, although there are also limitations; for example, the analysis in Section 4 cannot currently be conducted with listeners included as a random factor, due to technical limitations in mgcv concerning support for R’s “long vectors.” Since individual differences are not within the scope of the current paper, we leave this disentanglement of individual skill and the presently described group effects to future work.
Independently from these individual differences, however, the data provide evidence that the accent placements elicited by the task are mediated by sociolinguistic representations. A major piece of evidence for this is provided by the clusters observed in Section 6. Rather than clustering around the twenty places of origin that were truly present in the stimuli, they revolved around both geopolitical landmarks (e.g. the province boundaries) and sociolinguistic ones (e.g. the additional subdivisions of dialectologically salient areas). These observations are not compatible with an account by which listeners simply match speech stimuli to their putative places of origin. Rather, they show evidence of an intermediate step of an abstract sociolinguistic representation of country-wide aspects of regional variation. This also makes it possible to explain how the listeners, collectively, were able to distinguish a Frisian accent in our stimulus materials, even though no such accent had been included. That result could straightforwardly have been obtained by a sufficient number of listeners being sufficiently off in their placement of (one or more of) the speakers. However, an explanation in terms of many listeners being off is not very satisfying in explaining why a sufficient number of listeners made a sufficiently large mistake for the province to come out as a separate cluster. The fact that the province boundaries of Friesland were provided to the listeners on its own cannot explain this either. The position of Friesland, combined with the evidence from those clusters that do not follow the canonical province boundaries, shows that listeners must recruit some kind of mental representation of sociolinguistic variation—one in which, apparently, Friesland is a separate entity, as are East and West Brabant (which belong to a single geographical province), as is the North-East Polder (which belongs to two different provinces, yet is treated as a single sociolinguistic unit).
7.2. Implications for perceptual dialectology
The different methodological approaches in perceptual dialectology are traditionally summarized as being either mental or stimulus-driven. In mental tasks like the draw-a-map task (Preston, Reference Preston1981), listeners produce a mental map based entirely on their (sub)consciously accessible conceptions of regional variation in language use. By contrast, stimulus-driven tasks displace the burden of establishing regional characteristics from the listener to the researcher: the researcher carefully selects representative materials to use as input, and the idea is that the listener then “merely” places the provided stimuli on a map, without explicitly accessing their (sub)conscious regional associations. The map-based accent-recognition task clearly falls into the category of stimulus-driven methods. The aforementioned results show that this task does not directly elicit speech–space correspondences, but rather does so indirectly, being mediated by sociolinguistic representations. We do not believe this to be particular to the map-based accent-recognition task. Rather, we find it more likely that this is a general property of stimulus-driven tasks. In other words, tasks that are stimulus-driven are subject to being sociolinguistically represented, just like mental tasks. Results provided in both types of tasks are clearly mediated by sociolinguistic knowledge. Rather, the key difference between these two types of tasks is in who is in control of accessing these representations: the participant (as one is free to do so) or the researcher (through careful selection of representative stimuli). The current task in fact pushed further the methodological reasoning used by Cramer (Reference Cramer2010), Pinget & Voeten (Reference Pinget and Voeten2023), and Plichta & Preston (Reference Plichta and Preston2005), expanding along the lines of careful stimuli selection and detailed geographical maps to collect refined, perceptual-dialectological data, and proposed the adequate, quantitative analyses of those.
The results from the task display both external and convergent validity. The results from the Poisson model presented in Section 4 show that listeners, generally speaking, place speakers in geographical areas loosely related to the speakers’ true regional origins. This shows that our listeners, in all likelihood, indeed based their speaker placements on their regional origins as revealed through their regional accents, rather than having been confounded by another factor. This is a prerequisite for external validity. In addition, our results displayed convergent validity with the independently collected data by Heeringa & Nerbonne (Reference Heeringa and Nerbonne2006). The correlation was r = .50, which means that 25% of our observed differences in perceptual distinctiveness could be explained by the objective linguistic distances as measured in Heeringa & Nerbonne’s (Reference Heeringa and Nerbonne2006) production data. The objective distances in these production data were operationalized as Levenshtein distances comparing phoneme alignments in words from different dialects.
7.3. Future directions
The results from the present study have implications for our knowledge of the Dutch accent landscape. The results from Sections 4 and 5 provided a perceptual validation of known patterns of regional dialectology from production. Moreover, the results from Section 6 provided a map of the perceptual isoglosses underlying these results in listeners’ mental representations of sociolinguistic knowledge. A key result is that this representation is simultaneously broad as well as fine. Listeners’ sociolinguistic representations are broad, because the results from Section 4 showed that listeners did not always place speakers with great precision, and Section 5 showed that the observed perceptual distinctiveness of our speakers largely came down to the periphery against the middle. However, there is an important complement to this coarseness, in that Section 6 showed that the clicks by the listeners were informed by dialectological knowledge that was more fine-grained than would be predicted on the basis of simple geography. The observed perceptual isoglosses in that section followed known divisions in Dutch dialectology, such as the separation of the areas of Twente and the Achterhoek from their provinces of Overijssel and Gelderland. The granularity of some of these divisions is deserving of further study. For instance, while it is phonetically not surprising that specifically Arnhem and Nijmegen are clustered together into a separate dialect area, this is not a stereotypically distinct area in the way that Twente or the Achterhoek are. We recommend that future research identify the precise phonetic correlates that make this area accentually distinct, in the minds of our listeners. This may result in the identification of new (clusters of) phonetic indicators or markers.
We can identify a few additional areas of possible future research. One concerns the extent to which the aforementioned novel subdivisions were contributed by individual listeners. It stands to reason that a delineation of specifically the area of Arnhem and Nijmegen, for instance, might be contributed primarily by listeners who themselves originate from that area, and who are hence familiar with the accentual features that distinguish it from the surrounding isoglosses. Future research might explore this familiarity effect further by recruiting listeners with specific regional backgrounds, for example who are specifically from one of the 257 places for which Heeringa & Nerbonne (Reference Heeringa and Nerbonne2006) have production data. Do such listeners carve up their specific corner of the country into more fine-grained isoglosses than the countrywide isoglosses we see in Section 5? This, and other, aspect(s) of individual differences are deserving of follow-up.
A second opportunity for future research concerns the role of sociolinguistic salience. While we had removed lexical shibboleths from the stimulus materials, we did not specifically control for the number or the type of phonetic features. Because we had not specifically controlled these, we do not yet know which features actually elicited which aspects of accent placement. While we do have, of course, general ideas based on ample dialectological literature (e.g. about the stereotyped pronunciation of /x,ɣ/ in Brabant and Limburg [van der Harst, Van de Velde & Schouten, Reference Harst, Van de Velde and Schouten2007], or the realization of /ϵi/ in various regions of Dutch [Jacobi, Reference Jacobi2009; van der Harst, Reference Harst2011]), it remains to be established to what extent any such specific features indeed guided our listeners’ accent placements. This open question essentially amounts to a request to operationalize the sociolinguistic notion of “salience” (cf. Rácz, Reference Rácz2013) for the Netherlandic accent continuum. One successful attempt at doing so has been through a type of matched-guise task known as the “Newscast” experiment (Levon & Fox, Reference Levon and Fox2014). We recommend that future research utilize a similar approach, ideally coupled with production measures, to figure out what features of accented Dutch speech materials trigger the emergent regional associations that we have seen.
As a third option, future research might further explore the nature of the correlation of r = .50 between our perceptual results and the production data by Heeringa & Nerbonne (Reference Heeringa and Nerbonne2006). On the one hand, this correlation of .50 is very informative and validates the task: listeners indeed use existing differences at the phonetic level to trace speakers’ regional origins. On the other hand, it leaves us with the rest of the variation in perceptual distinctiveness still to be explained. At this point, we can only speculate about how to explain the remaining variation. One important possibility, suggested to us by Hans Van de Velde (p.c.), is that regional variation in Standard Dutch (our data) is more divided along the north–south axis, while the Dutch dialect continuum (Heeringa & Nerbonne) is more divided along the east–west axis; this discrepancy could have contributed to the mildness of the correlation. Second, it is possible that speakers are perceptually sensitive to or use their knowledge of subtle phonetic information, more subtle than what can be measured by Levenshtein distances, because these distances only rely on differences between (and not within) phoneme categories. Third, it is very possible that the sociolinguistic knowledge accessed by listeners to recognize speakers’ origins involve other linguistic levels than the phonetic level. Future research might explore whether and how listeners use chunks of information at the lexical or morpho-syntactic levels. When applying the little-arrow method, Weijnen (Reference Weijnen1946) believed that informants mainly consider phonetic features, as he considered them “sharper” than syntactic and morphological features and less specific than those which arise from lexical variation. The task was of a mental nature while, in the map-based accent-recognition task, we have control over the types of linguistic features we include in the stimuli. In any case and even if this type of linguistic information is not present in the stimuli, listeners might use their sociolinguistic knowledge about lexical and syntactic variation to place speakers on the map. Apart from those features, it is also possible that informants attend to additional linguistic features that are not traditionally studied by dialectologists (e.g. speech rate, intonation, etc.). Finally, we need to realize that variation in perception involves more than linguistic awareness: informants might take various kind of religious (Protestant vs. Catholic), social (industrial vs. agricultural), former and current political borders into consideration. The field of perceptual dialectology would benefit from a more systematic study of the types of information listeners take into account when perceiving diatopic variation.
A fourth possibility for future research, recommended to us by an anonymous reviewer, is to further study the way participants engage with the task. As an example, we interpreted the periphery effects we observed in Section 4.3 in terms of known facts about the historical development of the Dutch dialects, which naturally yielded more levelled accents in the central parts of the country, and more distinctive accents in the peripheries (Wieling, Nerbonne & Baayen, Reference Wieling, Nerbonne and Harald Baayen2011). However, an alternative possibility is that participants may in general just be attracted to edges in tasks involving maps. Similarly, while we took the Great Rivers as a natural boundary between the southern and non-southern dialects (this being a very well-known dialectological boundary in the Netherlands, even by laypeople; Cornips, Reference Cornips2018), it is also a very visually salient boundary in tasks involving maps like ours. The implications of such task-specific effects should be investigated. As an example, we are currently conducting a new study in which we are also collecting participants’ zoom levels in the Google Maps interface; could these zoom levels be indicators of participants’ familiarity with the area and/or confidence in their accent placement? A different option raised by the anonymous reviewer would be to incorporate an eyetracking component into the task; present-day technology for conducting online experiments, such as PCIbex (Zehr & Schwarz, Reference Zehr and Schwarz2018), can do this using participants’ own webcams.
Continuing, finally, with methodological avenues for future work, we do not currently know to what extent the map-based accent-recognition task probes the same mental representations as other map-based tasks. While we have demonstrated that the task must involve some kind of sociolinguistic stereotyping (Section 7.1), this by no means automatically entails that the map-based accent-recognition task probes the same cognitive pool of sociolinguistic representations as, for instance, the draw-a-map task does. Careful experimental manipulation of targeted sociophonetic variables, for example by means of matched-guise experiments, may help shed further light on this, as may the concurrent administration of map-based accent-recognition and draw-a-map tasks, similar to the six-item concurrent test battery by Preston (Reference Preston1989a). We highly recommend that methodology-specific issues like these be further explored in future laboratory-sociolinguistic work, and we hope that they may ultimately lead to a unified sociolinguistic and psycholinguistic account of sociophonetic and social-evaluative processing.
8. Conclusion
The current study has provided a structured, empirical, and data-driven method based on emergent patterns in perception in order to investigate the associations between speech and space, define the perceptual distance among places, and identify perceptual isoglosses within a language continuum. The results reaffirm that listeners are able to place speakers on a map in at least a broad manner. We have observed that they do not do so based only on the raw speech stimuli themselves, but also on their general sociolinguistic knowledge. In other words, listeners’ accent recognition is mediated by their sociolinguistic awareness about accent differences. This suggests that the traditionally held methodological difference between mental tasks and stimulus-driven tasks in perceptual dialectology may not be that pronounced: even stimulus-driven tasks turn out to be mediated by sociolinguistic knowledge that goes beyond the provided speech stimuli and thus beyond the control of the researcher. We have additionally presented a measure of perceptual distinctiveness on the basis of the differences in the odds of placing particular speakers at particular points on the map. These perceptual-distinctiveness scores turned out to be both externally and convergently valid, in that they reproduced known dialectological epicenters and boundaries and were significantly correlated to independently collected distances in production. Finally, we have empirically derived perceptual isoglosses by means of a cluster analysis of the recognition data. All in all, we believe that the map-based accent-recognition task constitutes a worthwhile contribution both to the methodological toolkit available to researchers in dialectology, and to our knowledge of the present-day state of the Dutch language continuum within the Netherlands.
Acknowledgments
We are grateful to our colleagues Wilbert Heeringa, Martijn Kingma, Nika Stefan, and Hans Van de Velde for their extensive feedback on this project from conception to writing. We also thank the colleagues from the Digital Humanities Lab at Utrecht University, especially José de Kruif and Gerson Foks, who helped with setting up the experiments. Finally, we thank the audiences of NWAV 51, the 10th Sociolinguistics Circle, and the XIII Dei fan de Fryske Taalkunde for their constructive feedback on earlier versions of this work.
Competing interests
The authors declare none.


 Open access