Seasonal variation in deaths by suicide is an important study in terms of understanding the possible sociological and biological determinants of suicide and its prevention. Spring peaks for males and spring and autumn peaks for females were found in the UK (Reference Barraclough and WhiteBarraclough & White, 1978; Reference Meares, Mendelsohn and Milgrom-FriedmanMeares et al, 1981), Australia (Reference Eastwood and PeacockeEastwood & Peacocke, 1976; Reference Parker and WalterParker & Walter, 1982), Finland (Nayha, Reference Nayha1982, Reference Nayha1983) and Italy (Micciolo et al, Reference Micciolo, Zimmermann-Tansella and Williams1989, Reference Williams, Williams and Zimmermann-Tansella1991). A spring and late summer peak and a trough in winter months were found for suicides for both men and women in the USA (Reference LesterLester, 1971; Reference Lester and FrankLester & Frank, 1988). Massing & Angermeyer (Reference Massing and Angermeyer1985) give a comprehensive account of the effects of season on suicides in the 1960s and 1970s. Recently, a harmonic analysis was applied to examine suicides in Australia and New Zealand. Only one cycle for both men and women was observed (Reference Yip, Chao and HoYip et al, 1998). A similar finding was also observed in Hong Kong and Taiwan (Reference Ho, Chao and YipHo et al, 1997). The present study attempts to examine seasonal effects on suicides in England and Wales with respect to gender, age group and method of suicide. We have two objectives: to verify the findings in Meares et al (Reference Meares, Mendelsohn and Milgrom-Friedman1981) and Barraclough and White (Reference Barraclough and White1978) about the seasonal effect in England and Wales, i.e. men showed a single 12-month cycle, whereas women showed two cycles; and to investigate whether seasonal variation is found more strongly in some subgroups of the population (e.g. by age or method of suicide) than in others.
METHOD
The Office for National Statistics (England & Wales) provided data for all deaths by suicide for the period 1982-1996. Information on age, gender, method and month of suicide was also made available. The data included here relate to cases where judicial inquiries established that the cause of death was suicide. They were coded in the range E950-959 of ICD-10 (World Health Organization, 1992). The chosen period enabled comparison with results obtained in the 1960s and 1970s (Reference Barraclough and WhiteBarraclough & White, 1978; Reference Meares, Mendelsohn and Milgrom-FriedmanMeares et al, 1981).
The seasonal variations in suicides were examined in three ways. First, the number of suicides in England and Wales for each month of the period 1982-1996 was plotted separately for each gender. Second, a daily mean suicide incidence and cumulative number of suicides were calculated for each month of the study period. Third, a harmonic time series model was applied to different genders, age groups and methods of suicide. The method of analysis was similar to that employed by Barraclough & White (Reference Barraclough and White1978), Micciolo et al (Reference Williams, Williams and Zimmermann-Tansella1991), Ho et al (Reference Ho, Chao and Yip1997) and Yip et al (Reference Yip, Chao and Ho1998). In this model, the variation in suicides between the months is described as the sum of the sinusoidal curves. The seasonal variation consists of those components with cycles that repeat themselves an exact number of times per year. Let Ai be the number of suicides for month i; for a period of 15 years (180 months),

where aj and bj are constant (j=1,…, 90), a o is the mean suicide number and
is commonly referred to as the jth harmonic of Ai with period 15/j years and frequency per annum j/15. The harmonics with j=15, 30, 45, 60, 75 and 90 have periods of 1, 1/2, 1/3, 1/4, 1/5 and 1/6 years and frequencies per annum of 1, 2, 3, 4, 5 and 6, respectively. For example, one such sinusoidal curve is that with a period of 6 months (1/2 year), which has just two peaks and two troughs in each year. These harmonics have a cycle that repeats an exact number of times per year and follows the same pattern in years as any combinations of such harmonics. The quantities aj and bj are estimated so as to give the best fit to the data, and they describe the amplitudes of the separate sinusoidal components. The significance of a particular component j is ascertained by testing whether aj and bj are significantly different from zero; if they are not, it may be concluded that there is no seasonal variation. It is assumed that the total variance of the distribution of the monthly suicide data can be broken down into three components: random, seasonal and non-seasonal. In this way it is possible to calculate the percentage of total variance attributable to seasonal variation, as well as to random and non-seasonal variation. Under the alternative hypothesis, that the variation is purely random, the monthly totals may be considered as independent identically distributed Poisson random variables. The details of testing the significance of the different components of the variation can be found in Pocock (Reference Pocock1974), Barraclough & White (Reference Barraclough and White1978) and Yip et al (Reference Yip, Chao and Ho1998).
RESULTS
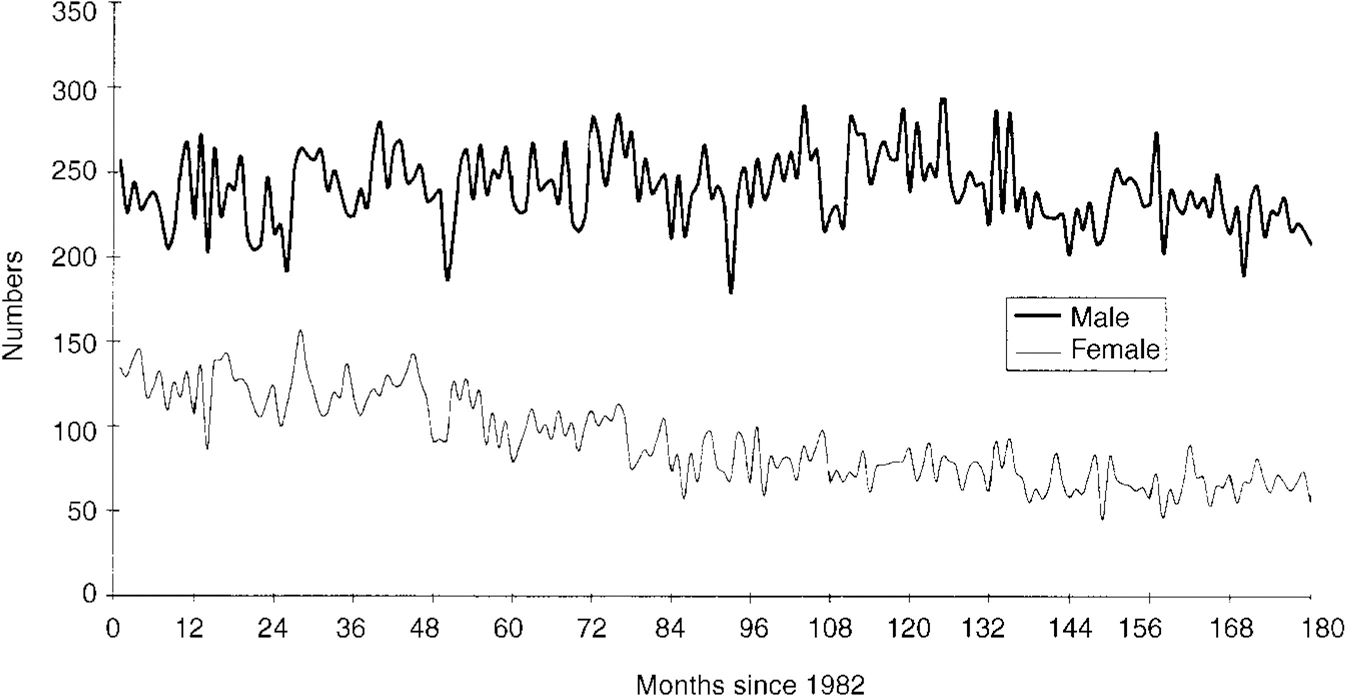
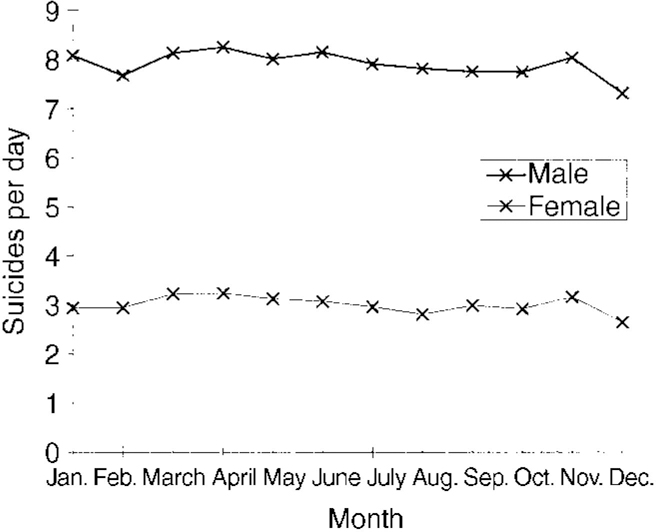
A total of 59 608 (43 229 males and 16 379 females) suicides were identified in England and Wales for the period 1982-1996. The age-specific suicide rates by gender for the study period were plotted and are shown in Fig. 1. A statistically significant decreasing trend was observed in the group (male and female) aged 60 years or over (P <0.05). On the other hand, an increase in the suicide rate among males of age 15-24 years was noted (P <0.05). Suicide rates increased with age among females, but not among males. Males aged 25-39 years have shown the highest rate since 1994. The monthly distribution of suicides, for males and females is shown in Fig. 2. The cumulative number of suicides for both males and females, and the monthly mean number of suicides per day are shown in Table 1 and Fig. 3, respectively. The assumption of even distribution of suicides was rejected (P <0.01): December had a trough for both males and females.

Fig. 1 Age-specific suicide rates (per 100 000) in England and Wales, 1982-1996: [UNK], male 60+; [UNK], male 40-59; [UNK], male 25-39; [UNK], male 15-24; [UNK], female 60+; [UNK], female 40-59; [UNK], female 25-39; [UNK], female 15-24.

Fig. 2 Monthly distribution of suicide deaths in England and Wales, 1982-1996.

Fig. 3 Monthly averages of suicide incidence over 15 years in England and Wales, 1982-1996.
Table 1 The observed and expected number of suicides by month and gender in England and Wales, 1982-1996

| January | February | March | April | May | June | July | August | September | October | November | Dececember | |
|---|---|---|---|---|---|---|---|---|---|---|---|---|
| Male | ||||||||||||
| Observed | 3755 | 3251 | 3777 | 3706 | 3717 | 3660 | 3669 | 3626 | 3481 | 3590 | 3605 | 3392 |
| Expected1 | 3669 | 3345 | 3669 | 3550 | 3669 | 3550 | 3669 | 3669 | 3550 | 3669 | 3550 | 3669 |
| χ2=43.98, d.f.=11, P<0.0001 | ||||||||||||
| Female | ||||||||||||
| Observed | 1362 | 1244 | 1496 | 1452 | 1448 | 1376 | 1370 | 1301 | 1337 | 1351 | 1416 | 1226 |
| Expected1 | 1390 | 1268 | 1390 | 1345 | 1390 | 1345 | 1390 | 1390 | 1345 | 1390 | 1345 | 1390 |
| χ2=50.90, d.f.=11, P<0.0001 | ||||||||||||
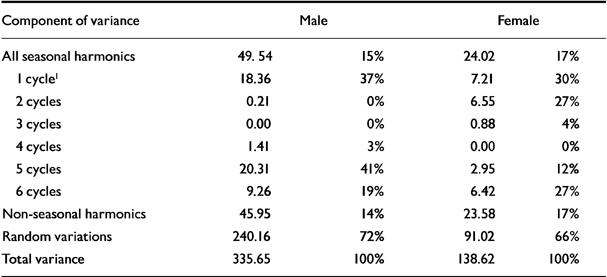
Table 2 shows the results of harmonic analysis by gender. Only 15 and 17% of the total variations can be explained by the seasonal component for males and females, respectively. The effects of all seasonal harmonics are marginally statistically significant, with P≅0.05. In order to examine the possible determinant factors of season by different subgroups, the figures for age and methods of suicide were also subjected to the same analysis. The results obtained on the seasonal components (not shown here) are not statistically significant.
Table 2 Harmonic analysis of monthly data on suicides in England and Wales, 1982-1996

| Component of variance | Male | Female | ||
|---|---|---|---|---|
| All seasonal harmonics | 49.54 | 15% | 24.02 | 17% |
| 1 cycle1 | 18.36 | 37% | 7.21 | 30% |
| 2 cycles | 0.21 | 0% | 6.55 | 27% |
| 3 cycles | 0.00 | 0% | 0.88 | 4% |
| 4 cycles | 1.41 | 3% | 0.00 | 0% |
| 5 cycles | 20.31 | 41% | 2.95 | 12% |
| 6 cycles | 9.26 | 19% | 6.42 | 27% |
| Non-seasonal harmonics | 45.95 | 14% | 23.58 | 17% |
| Random variations | 240.16 | 72% | 91.02 | 66% |
| Total variance | 335.65 | 100% | 138.62 | 100% |
DISCUSSION
The present study suggests that the marked seasonal fluctuation in suicide rates found in England and Wales in the 1960s and 1970s appears to be diminishing, and in some cases it has vanished completely (Reference Barraclough and WhiteBarraclough & White, 1978; Reference Meares, Mendelsohn and Milgrom-FriedmanMeares et al, 1981). Barraclough & White (Reference Barraclough and White1978) used the same method as described here. They examined the seasons during the period between 1968 and 1972 and found that 49.3% of the variation could be explained by season, with the adjusted ratio 2.5:1 of the components of all seasonal harmonics to random. The effect of season on suicide during the period 1982-1996 accounts for only 15-17% of the variation. The results suggest, therefore, a significant reduction in the proportion of variance accounted for by season. We examined the possible confounding factors, such as age and method of suicide, and found nothing to be significant. Also, we included the undetermined causes of death (E980-989) in the analysis and similar results were obtained. Seasonal components were not significant.
Reduction in seasonal fluctuation observed in other countries
Similar findings using the same harmonic analysis were obtained in other countries: for example, Micciolo et al (Reference Micciolo, Zimmermann-Tansella and Williams1989) suggested that 48-65% of the variance in Italy's suicide data in the 1970s was explained by seasonal components; in the 1980s and 1990s this figure was only 25-32% in Hong Kong and Taiwan (Reference Ho, Chao and YipHo et al, 1997), and 3-17% in Australia and New Zealand (Reference Yip, Chao and HoYip et al, 1998).
Significant reduction in suicides among the widowed and divorced
The reduction of the seasonal component can be explained by the significant reduction in suicides among the widowed and divorced in England and Wales for the past two decades. In fact, the decrease in suicide rates in England and Wales from the widowed and divorced groups accounts for most of the overall fall in the suicide rate for men and women. For example, the suicide rates for males and females aged 60 years or over have fallen from 18.2 to 11.1 and from 10.9 to 4.0, respectively, for the period 1982-1996. The precise reasons for the decrease among the widowed and divorced, especially among the elderly, are yet to be determined. It has been shown that in Finland the autumn peak is related to marital status. There was a high frequency of suicides among the divorced (and possibly widowed) in September. Furthermore, divorced males, who are known to be located in a lower than average position in the social scale, might be claimed to be liable to suicide in autumn, owing to the increased unemployment rate at that time of the year (Reference NayhaNayha, 1983; Reference YipYip, 1997). Reduction of suicide for the two groups would have an impact on the seasonal variations in suicides.
Change of lifestyle
Durkheim (Reference Durkheim1897) believed that seasonal variation in suicidal behaviour was determined by the intensity of communal life and activities. Technological development in telecommunications and the fact that people tend to be ‘connected’ more often than before (for example, by mobile phones, e-mail and the internet) and also the different activities and social contacts nowadays, all may play a part in determining the seasonal effect on suicide.
The exact impact of these changes on the seasonal variation in suicides is far from clear, but it is not surprising to see a reduction in the seasonal influence on the distribution of suicides.
In conclusion, the present study found that the seasonal effect on suicides in England and Wales is less obvious than previous studies suggested. The present finding challenges the existence of seasonal effects and predicts that seasonal variation in suicides will disappear in the new millennium.
Clinical Implications and Limitations
CLINICAL IMPLICATIONS
-
▪ Suicide risk was more uniformly distributed throughout the year than before, which might have implications for planning support services for those at risk of or attempting suicide.
-
▪ Sociocultural factors may play a more significant role in determining the seasonal effect in suicides.
-
▪ The decrease in suicides among the high-risk groups of the widowed and divorced is encouraging. It is important to understand the reason(s) in order to be able to reduce the suicide rates further in England and Wales.
LIMITATIONS
-
▪ The results would be more statistically powerful if a longer series of data were available, although 15 years of data are quite sufficient.
-
▪ The effect of underreporting of suicides on the seasonal effect is yet to be determined.
-
▪ We were unable to determine the biological effect (e.g. seasonality in suicide mirroring seasonality in onset of biological depression and mania) on the reduction of seasonal variation of suicide.
ACKNOWLEDGEMENTS
We are grateful to James Thorburn and the three referees for the very useful suggestions and to the Office for National Statistics and the Office of Population Censuses and Surveys (England & Wales) for supplying the data for the present study. This work is supported by a CRCG grant from the University of Hong Kong.


eLetters
No eLetters have been published for this article.