It is possible that paranoid ideation is almost as common as symptoms of anxiety and depression (e.g. Reference Van Os, Verdoux, Murray, Jones and Susservan Os & Verdoux, 2003; Reference Johns, Cannon and SingletonJohns et al, 2004). For many people, thoughts that friends, acquaintances or strangers might be hostile, or deliberately watching them, appear to be an everyday occurrence. This may parallel the findings of earlier studies that a level of obsessive thinking is normal in the general population (Reference Rachman and de SilvaRachman & de Silva, 1978). In one way this is not surprising, because being wary of the intentions of others is adaptive in some situations. At a cultural level, a fear of others is variably incorporated into the political and social climate. In general such thoughts are not a clinical problem, becoming so only when they are excessive, exaggerated or unfounded, and cause distress. Paranoid thoughts in non-clinical populations are phenomena of interest in their own right and may inform our understanding of delusions.
This study provides information on the frequency in a non-clinical sample of paranoid ideation, and the associated levels of conviction and distress. Such information can be useful to present to patients in the clinical setting, but no comparable research examining a wide range of paranoid thoughts, or considering such thoughts from a multidimensional perspective, has hitherto been published. There is no published evidence on, for example, the weekly frequency of paranoia in the general population. We predicted that the distribution of suspicious thoughts would be similar to that of affective symptoms, with many people having a few suspicious thoughts and a few people having many (Reference Melzer, Tom and BrughaMelzer et al, 2002). Moreover, as with affective symptoms, increasing symptom counts will be characterised by the recruitment of rarer and odder ideas (Reference SturtSturt, 1981). There may be a hierarchy of paranoid thoughts. The study also had the aim of identifying how individuals in the general population cope with paranoid thoughts. We wished to identify the coping strategies that were associated with the most and the least distress. Finally, we examined potential connections between paranoia and three social–cognitive processes: attitudes to emotional expression, social comparison and submissive behaviours.
METHOD
Participants and procedure
An anonymous internet survey was considered to provide a safe environment for survey participants to disclose suspicious thoughts. Internet research has been found to reach the same conclusions as laboratory-based studies (Reference BirnbaumBirnbaum, 2001). Students at King's College London, the University of East Anglia and University College London were e-mailed the address of a website where they could take part in a survey of ‘everyday worries about others’. The study had received the approval of local research ethics committees. Completion of each questionnaire was timed, and one submission completed too quickly (<45 s) was deleted. Paranoia Checklist questionnaires with more than five pieces of missing data (i.e. completion rate less than 90%) were not included; consequently, the percentage of the Paranoia Checklist data that were prorated was minimal (<0.5%). The final sample comprised 1202 people. After providing demographic information, participants were presented with six questionnaires.
Questionnaires
Paranoia Scale
The 20-item, self-report Paranoia Scale (Reference Fenigstein and VanableFenigstein & Vanable, 1992) was developed to measure paranoia in college students. Each item is rated on a five-point scale (1 not at all applicable, 5 extremely applicable). Scores can range from 20 to 100, with the higher scores indicating greater paranoid ideation. It is the most widely used dimensional measure of paranoia. However, the scale contains many items that are not clearly persecutory (e.g. ‘My parents and family find more fault with me than they should’) and does not provide an estimate of the frequency or distress of paranoid thoughts. The Paranoia Checklist was therefore developed specifically for this study.
Paranoia Checklist
The Paranoia Checklist was devised to investigate paranoid thoughts of a more clinical nature than those assessed in the Paranoia Scale and to provide a multi-dimensional assessment of paranoid ideation. The checklist has 18 items, each rated on a five-point scale for frequency, degree of conviction, and distress. We report the convergent validity of the Paranoia Checklist in relation to the Paranoia Scale in the results section.
Coping Styles Questionnaire
The Coping Styles Questionnaire (CSQ; Reference Roger, Jarvis and NajarianRoger et al, 1993) builds upon the Ways of Coping Checklist (Reference Folkman and LazarusFolkman & Lazarus, 1980), and was validated with a UK student sample. The questionnaire comprises 60 coping strategies rated on a four-point frequency scale. Participants were asked to complete the questionnaire for how they typically react to the worries assessed in the Paranoia Checklist. There are four factors: rational coping, detached coping, emotional coping and avoidance coping. The former two factors are considered by the questionnaire developers as adaptive and the latter two as maladaptive.
Attitudes to Emotional Expression Questionnaire
On the Attitudes to Emotional Expression Questionnaire (Reference Joseph, Yule and WilliamsJoseph et al, 1994) respondents were asked to rate how much they agree on a five-point scale (1 agree very much, 2 agree slightly, 3 neutral, 4 disagree slightly, 5 disagree very much) with four attitudes to emotional expression (e.g. ‘I think you should always keep your feelings under control’). Higher scores indicate more positive attitudes to emotional expression.
Social Comparison Scale
On the Social Comparison Scale (Reference Gilbert and AllanGilbert & Allan, 1994) participants rate, by selecting a number between 1 and 10, whether they generally feel in relation to others: inferior–superior; less competent–more competent; less likeable–likeable; more reserved–less reserved; left out–accepted. Higher scores indicate higher perceived social rank.
Submissive Behaviours Scale
The Submissive Behaviours Scale (Reference Allan and GilbertAllan & Gilbert, 1997) is a 16-item scale assessing a number of behaviours considered as submissiveness (e.g. ‘I agree that I am wrong, even though I know I'm not’). Each behaviour is rated on a five-point scale (0 never, 4 always). Higher scores indicate greater use of submissive behaviours.
Analysis
Analyses were conducted using the Statistical Package for the Social Sciences, SPSS for Windows, version 11.0 (SPSS, 2001). Significance test results are quoted as two-tailed probabilities.
RESULTS
Demographic data
There were more women (n=821) than men (n=371) among the respondents. Although the World Wide Web was once considered predominantly a male preserve, studies have found that more women than men participate in online psychological studies (Reference BirnbaumBirnbaum, 2001). The average age was 23.0 years (s.d.=6.1, range 17–61, interquartile range 5). The respondents reported their ethnicity predominantly as White (n=1001), followed by Asian (n=98) and ‘other’ (n=70). There were few Black African (n=9) and African–Caribbean (n=9) respondents.
Reliability and validity of the Paranoia Checklist
Cronbach's a for each of the three dimensions of the Paranoia Checklist was 0.9 or above, indicating excellent internal reliability. As would be expected, time taken to complete the Paranoia Checklist had a small positive correlation with a total score for frequency, conviction and distress (r=0.10, P<0.001). The Paranoia Scale was completed by 1016 of the Paranoia Checklist respondents. The mean Paranoia Scale score of the total group was 42.7 (s.d.=14.3), which is comparable with that reported by Fenigstein & Vanable (Reference Fenigstein and Vanable1992). There was convergent validity of the checklist with the Paranoia Scale: higher Paranoia Scale scores correlated with Paranoia Checklist frequency (r=0.71, P<0.001), conviction (r=0.62, P<0.001) and distress scores (r=0.58, P<0.001).
Prevalence of thoughts with a paranoid content
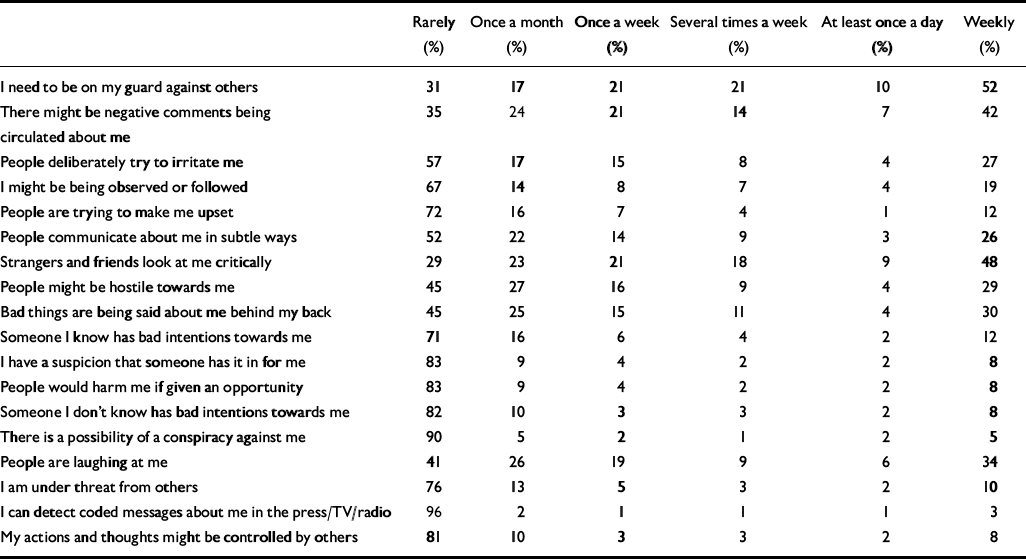
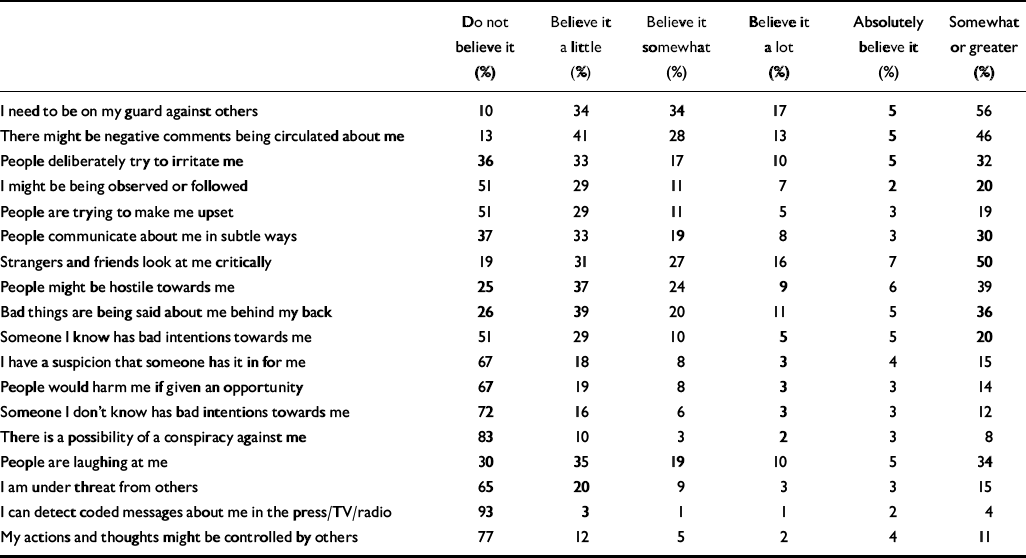
The frequencies, conviction and distress associated with the suspicious thoughts assessed in the Paranoia Checklist are displayed in Tables 1, 2, 3. There was appreciable endorsement of the checklist items. The 1-week prevalence of the individual thoughts ranged from 3% (‘I can detect messages about me in the press/TV/radio’) to 52% (‘I need to be on my guard against others’) (Table 1). The mean frequency score was 11.9 (s.d.=10.5, range 0–64; 25th percentile 4.0, 50th percentile 9.0, 75th percentile 16.0). Between 2% and 7% of participants adhered to individual thoughts with a level of absolute conviction (Table 2). If we consider levels of belief of ‘somewhat’ or greater, there is more variation between the individual items (4–56%). The mean conviction score was 16.7 (s.d.=12.1, range 0–72; 25th percentile 8.0, 50th percentile 14.0, 75th percentile 22.0). Between 1% and 7% of participants found individual thoughts very distressing (Table 3). Again, there was more variation between the thoughts if distress was taken as ‘at least somewhat distressing’ or greater (3–42%). The mean distress score was 14.6 (s.d.=12.2, range 0–70; 25th percentile 5.0, 50th percentile 12.0, 75th percentile 21.0).
Table 1 Frequency (‘How often have you had the thought?’) (n=1202)
| Rarely (%) | Once a month (%) | Once a week (%) | Several times a week (%) | At least once a day (%) | Weekly (%) | |
|---|---|---|---|---|---|---|
| I need to be on my guard against others | 31 | 17 | 21 | 21 | 10 | 52 |
| There might be negative comments being circulated about me | 35 | 24 | 21 | 14 | 7 | 42 |
| People deliberately try to irritate me | 57 | 17 | 15 | 8 | 4 | 27 |
| I might be being observed or followed | 67 | 14 | 8 | 7 | 4 | 19 |
| People are trying to make me upset | 72 | 16 | 7 | 4 | 1 | 12 |
| People communicate about me in subtle ways | 52 | 22 | 14 | 9 | 3 | 26 |
| Strangers and friends look at me critically | 29 | 23 | 21 | 18 | 9 | 48 |
| People might be hostile towards me | 45 | 27 | 16 | 9 | 4 | 29 |
| Bad things are being said about me behind my back | 45 | 25 | 15 | 11 | 4 | 30 |
| Someone I know has bad intentions towards me | 71 | 16 | 6 | 4 | 2 | 12 |
| I have a suspicion that someone has it in for me | 83 | 9 | 4 | 2 | 2 | 8 |
| People would harm me if given an opportunity | 83 | 9 | 4 | 2 | 2 | 8 |
| Someone I don't know has bad intentions towards me | 82 | 10 | 3 | 3 | 2 | 8 |
| There is a possibility of a conspiracy against me | 90 | 5 | 2 | 1 | 2 | 5 |
| People are laughing at me | 41 | 26 | 19 | 9 | 6 | 34 |
| I am under threat from others | 76 | 13 | 5 | 3 | 2 | 10 |
| I can detect coded messages about me in the press/TV/radio | 96 | 2 | 1 | 1 | 1 | 3 |
| My actions and thoughts might be controlled by others | 81 | 10 | 3 | 3 | 2 | 8 |
Table 2 Conviction (‘How strongly do you believe it?’) (n=1202)
| Do not believe it (%) | Believe it a little (%) | Believe it somewhat (%) | Believe it a lot (%) | Absolutely believe it (%) | Somewhat or greater (%) | |
|---|---|---|---|---|---|---|
| I need to be on my guard against others | 10 | 34 | 34 | 17 | 5 | 56 |
| There might be negative comments being circulated about me | 13 | 41 | 28 | 13 | 5 | 46 |
| People deliberately try to irritate me | 36 | 33 | 17 | 10 | 5 | 32 |
| I might be being observed or followed | 51 | 29 | 11 | 7 | 2 | 20 |
| People are trying to make me upset | 51 | 29 | 11 | 5 | 3 | 19 |
| People communicate about me in subtle ways | 37 | 33 | 19 | 8 | 3 | 30 |
| Strangers and friends look at me critically | 19 | 31 | 27 | 16 | 7 | 50 |
| People might be hostile towards me | 25 | 37 | 24 | 9 | 6 | 39 |
| Bad things are being said about me behind my back | 26 | 39 | 20 | 11 | 5 | 36 |
| Someone I know has bad intentions towards me | 51 | 29 | 10 | 5 | 5 | 20 |
| I have a suspicion that someone has it in for me | 67 | 18 | 8 | 3 | 4 | 15 |
| People would harm me if given an opportunity | 67 | 19 | 8 | 3 | 3 | 14 |
| Someone I don't know has bad intentions towards me | 72 | 16 | 6 | 3 | 3 | 12 |
| There is a possibility of a conspiracy against me | 83 | 10 | 3 | 2 | 3 | 8 |
| People are laughing at me | 30 | 35 | 19 | 10 | 5 | 34 |
| I am under threat from others | 65 | 20 | 9 | 3 | 3 | 15 |
| I can detect coded messages about me in the press/TV/radio | 93 | 3 | 1 | 1 | 2 | 4 |
| My actions and thoughts might be controlled by others | 77 | 12 | 5 | 2 | 4 | 11 |
Table 3 Distress (‘How upsetting is it for you?’) (n=1202)

| Not distressing (%) | A little distressing (%) | Somewhat distressing (%) | Moderately distressing (%) | Very distressing (%) | At least somewhat distressing (%) | |
|---|---|---|---|---|---|---|
| I need to be on my guard against others | 33 | 36 | 18 | 11 | 3 | 32 |
| There might be negative comments being circulated about me | 25 | 34 | 20 | 16 | 6 | 42 |
| People deliberately try to irritate me | 48 | 30 | 11 | 7 | 4 | 22 |
| I might be being observed or followed | 55 | 23 | 11 | 7 | 3 | 21 |
| People are trying to make me upset | 53 | 23 | 13 | 7 | 5 | 25 |
| People communicate about me in subtle ways | 51 | 29 | 12 | 5 | 2 | 19 |
| Strangers and friends look at me critically | 34 | 31 | 18 | 12 | 5 | 35 |
| People might be hostile towards me | 35 | 34 | 18 | 10 | 4 | 32 |
| Bad things are being said about me behind my back | 34 | 31 | 17 | 11 | 7 | 35 |
| Someone I know has bad intentions towards me | 54 | 23 | 12 | 7 | 5 | 24 |
| I have a suspicion that someone has it in for me | 66 | 18 | 8 | 4 | 3 | 15 |
| People would harm me if given an opportunity | 67 | 15 | 7 | 4 | 6 | 17 |
| Someone I don't know has bad intentions towards me | 72 | 16 | 6 | 3 | 3 | 12 |
| There is a possibility of a conspiracy against me | 82 | 9 | 4 | 3 | 3 | 10 |
| People are laughing at me | 43 | 28 | 15 | 9 | 5 | 29 |
| I am under threat from others | 66 | 18 | 8 | 5 | 3 | 16 |
| I can detect coded messages about me in the press/TV/radio | 96 | 2 | 1 | 1 | 1 | 3 |
| My actions and thoughts might be controlled by others | 82 | 10 | 4 | 2 | 2 | 8 |
The different dimensions of the Paranoia Checklist were positively correlated. Frequency scores were correlated with conviction (r=0.75, P<0.001) and distress (r=0.66, P<0.001), and conviction and distress scores were also positively correlated (r=0.65, P<0.001). There were no differences between men and women in the frequency (t=0.66, d.f.=1190, P=0.51) or conviction (t=1.03, d.f.=1190, P=0.30) with which paranoid thoughts were experienced. Females did report a significantly higher level of distress associated with the thoughts (t=–2.72, d.f.=1190, P=0.007, mean difference –2.07, 95% CI –3.60 to – 0.58), although it can be seen that this difference is very small.
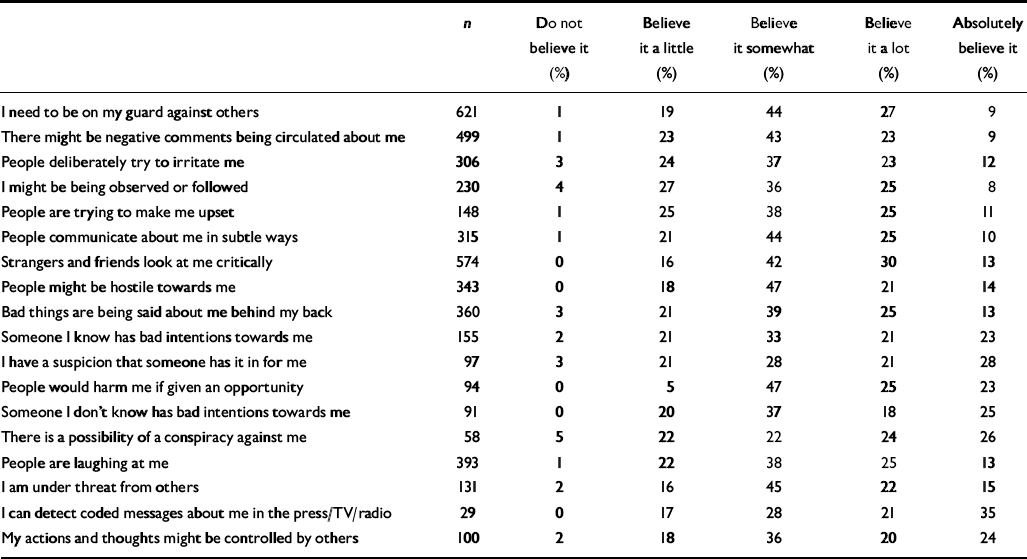
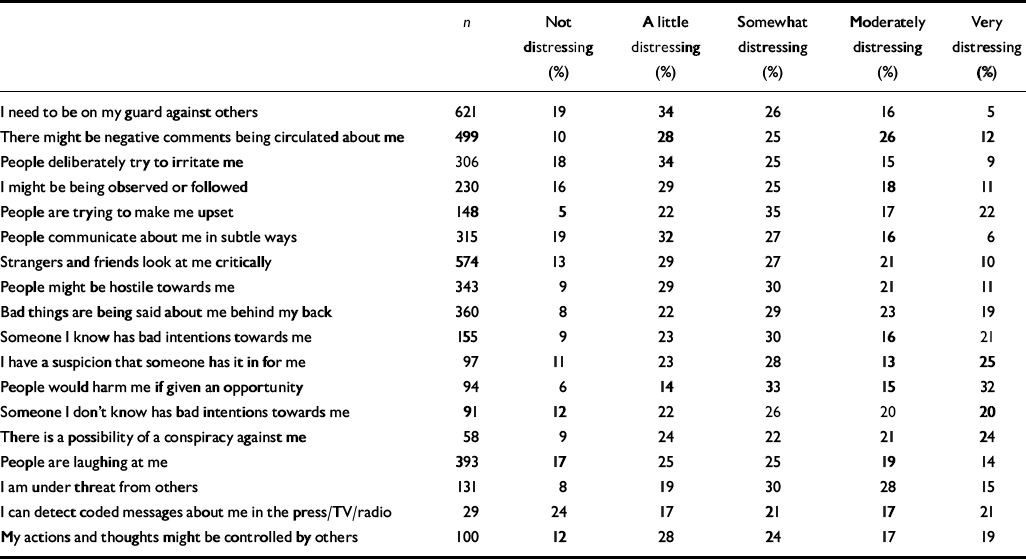
In Tables 4 and 5 the levels of conviction and distress associated with each suspicious thought are reported for the individuals experiencing such ideas at least weekly. Here it can be seen that the rarer and more implausible paranoid items (e.g. ‘There is a possibility of a conspiracy against me’) are held with the strongest levels of conviction and associated with the most distress. This is confirmed by high negative correlations between the frequency of (at least weekly) endorsement of questionnaire items and the percentage of people who believed the thought absolutely (n=18; r=-0.74, P<0.001) and with the percentage of people who found the thought very distressing (n=18; r=–0.75, P<0.001). In other words, the less frequently experienced thoughts were held with proportionately more conviction and distress.
Table 4 Level of conviction for those who experienced the thought at least weekly
| n | Do not believe it (%) | Believe it a little (%) | Believe it somewhat (%) | Believe it a lot (%) | Absolutely believe it (%) | |
|---|---|---|---|---|---|---|
| I need to be on my guard against others | 621 | 1 | 19 | 44 | 27 | 9 |
| There might be negative comments being circulated about me | 499 | 1 | 23 | 43 | 23 | 9 |
| People deliberately try to irritate me | 306 | 3 | 24 | 37 | 23 | 12 |
| I might be being observed or followed | 230 | 4 | 27 | 36 | 25 | 8 |
| People are trying to make me upset | 148 | 1 | 25 | 38 | 25 | 11 |
| People communicate about me in subtle ways | 315 | 1 | 21 | 44 | 25 | 10 |
| Strangers and friends look at me critically | 574 | 0 | 16 | 42 | 30 | 13 |
| People might be hostile towards me | 343 | 0 | 18 | 47 | 21 | 14 |
| Bad things are being said about me behind my back | 360 | 3 | 21 | 39 | 25 | 13 |
| Someone I know has bad intentions towards me | 155 | 2 | 21 | 33 | 21 | 23 |
| I have a suspicion that someone has it in for me | 97 | 3 | 21 | 28 | 21 | 28 |
| People would harm me if given an opportunity | 94 | 0 | 5 | 47 | 25 | 23 |
| Someone I don't know has bad intentions towards me | 91 | 0 | 20 | 37 | 18 | 25 |
| There is a possibility of a conspiracy against me | 58 | 5 | 22 | 22 | 24 | 26 |
| People are laughing at me | 393 | 1 | 22 | 38 | 25 | 13 |
| I am under threat from others | 131 | 2 | 16 | 45 | 22 | 15 |
| I can detect coded messages about me in the press/TV/radio | 29 | 0 | 17 | 28 | 21 | 35 |
| My actions and thoughts might be controlled by others | 100 | 2 | 18 | 36 | 20 | 24 |
Table 5 Level of distress for those who experienced the thought at least weekly
| n | Not distressing (%) | A little distressing (%) | Somewhat distressing (%) | Moderately distressing (%) | Very distressing (%) | |
|---|---|---|---|---|---|---|
| I need to be on my guard against others | 621 | 19 | 34 | 26 | 16 | 5 |
| There might be negative comments being circulated about me | 499 | 10 | 28 | 25 | 26 | 12 |
| People deliberately try to irritate me | 306 | 18 | 34 | 25 | 15 | 9 |
| I might be being observed or followed | 230 | 16 | 29 | 25 | 18 | 11 |
| People are trying to make me upset | 148 | 5 | 22 | 35 | 17 | 22 |
| People communicate about me in subtle ways | 315 | 19 | 32 | 27 | 16 | 6 |
| Strangers and friends look at me critically | 574 | 13 | 29 | 27 | 21 | 10 |
| People might be hostile towards me | 343 | 9 | 29 | 30 | 21 | 11 |
| Bad things are being said about me behind my back | 360 | 8 | 22 | 29 | 23 | 19 |
| Someone I know has bad intentions towards me | 155 | 9 | 23 | 30 | 16 | 21 |
| I have a suspicion that someone has it in for me | 97 | 11 | 23 | 28 | 13 | 25 |
| People would harm me if given an opportunity | 94 | 6 | 14 | 33 | 15 | 32 |
| Someone I don't know has bad intentions towards me | 91 | 12 | 22 | 26 | 20 | 20 |
| There is a possibility of a conspiracy against me | 58 | 9 | 24 | 22 | 21 | 24 |
| People are laughing at me | 393 | 17 | 25 | 25 | 19 | 14 |
| I am under threat from others | 131 | 8 | 19 | 30 | 28 | 15 |
| I can detect coded messages about me in the press/TV/radio | 29 | 24 | 17 | 21 | 17 | 21 |
| My actions and thoughts might be controlled by others | 100 | 12 | 28 | 24 | 17 | 19 |
To examine whether people who endorsed the rarer items also endorsed the more common suspicious thoughts with higher conviction and distress, we split the sample into those who endorsed at least one rare item (items with frequency less than 10%) (n=277) and those who did not endorse a rare item (n=925). The two groups were then compared on levels of conviction and distress for the eight most common items (endorsement rates of over 20%). Each one of these comparisons was made only for the individuals in the two groups who had endorsed the item (i.e. experienced the thought at least weekly). The rarer item group had significantly higher conviction rates for seven of the eight common suspicious thoughts and significantly higher distress levels for five of the eight common suspicious thoughts (P<0.05). It seems that individuals with the rarer thoughts were also experiencing the commoner thoughts more strongly.
We predicted that suspiciousness in the general population would have a profile similar to that of affective symptoms. First, there would be a single population distribution rather than evidence of a bimodal distribution (i.e between ‘clinical paranoia’ and ‘non-clinical paranoia’). Second, the rarer ideas would be associated with the presence of many other suspicions; put another way, the relationship between rare symptoms and common symptoms would be non-reflexive, in that the former would be more predictive of the latter than vice versa. The total number of checklist items endorsed by each person was first calculated (endorsement referring to weekly occurrence or above). The count of suspicious thoughts could therefore range from 0 to 18. The distribution of the count is displayed in Fig. 1. It can be seen that the suspicious thought count follows a single continuous model (Reference Melzer, Tom and BrughaMelzer et al, 2002). The distribution closely fits an exponential curve. To examine whether the rarer thoughts were associated with a higher rate of endorsement of other checklist items, the mean difference for the suspicious thought count was calculated between those with and those without each suspicious thought (correcting for the contribution due to that item; Reference SturtSturt, 1981). The mean difference (i.e. the excess of endorsement associated with each item) was significantly associated with the frequency of item endorsement (n=18; r=-0.75, P<0.001). Thus, the rarer checklist items were associated with a higher total score than were the more common ones. For example, endorsing the item ‘There might be negative comments being circulated about me’ (frequency 42%) was associated with endorsing 3.9 other checklist items in comparison with not endorsing the item. Endorsing the item ‘There is a possibility of a conspiracy against me’ (frequency 5%) was associated with endorsing 7.0 other checklist items in comparison with not endorsing the item.
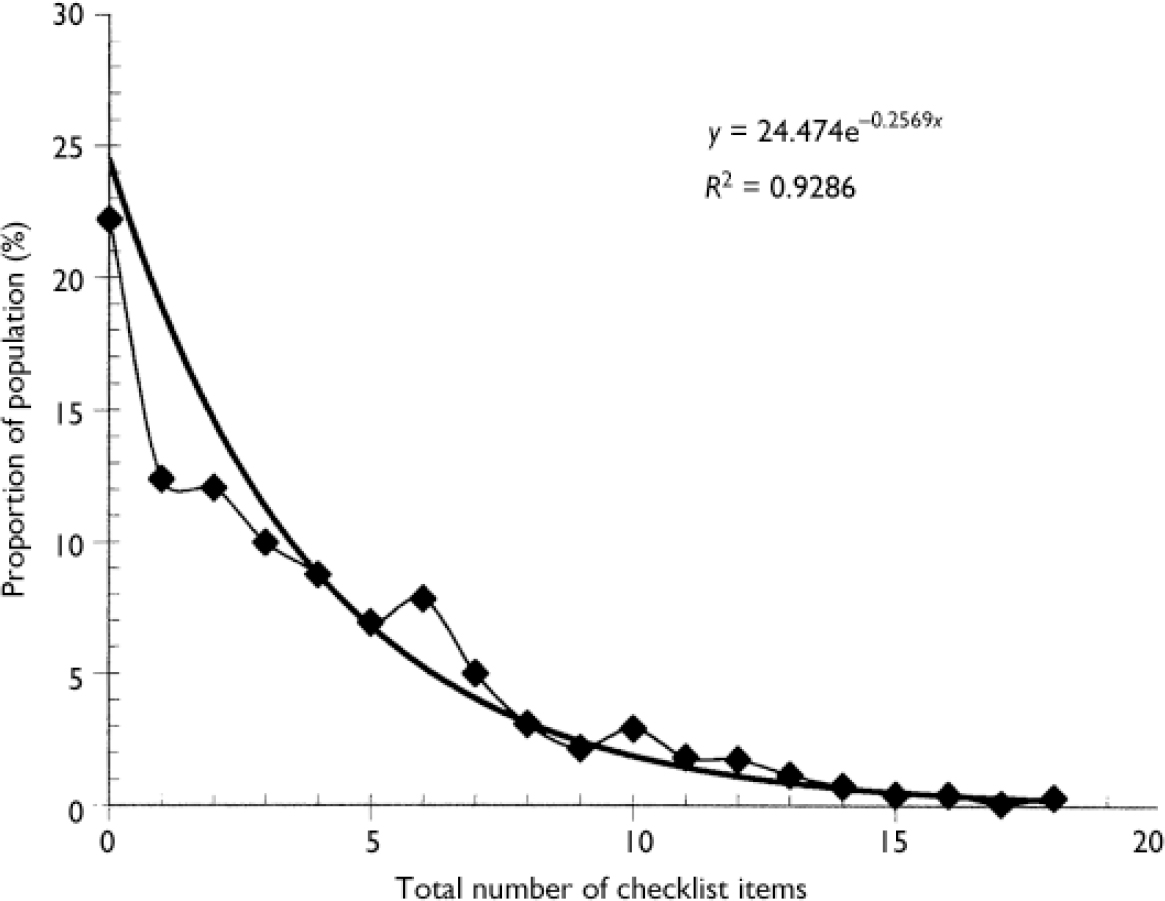
Fig. 1 Percentage of the study population v. total number of Paranoia Checklist items endorsed, with fitted exponential curve.
Coping with paranoid thoughts
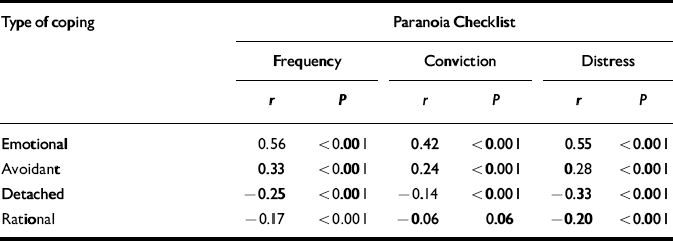
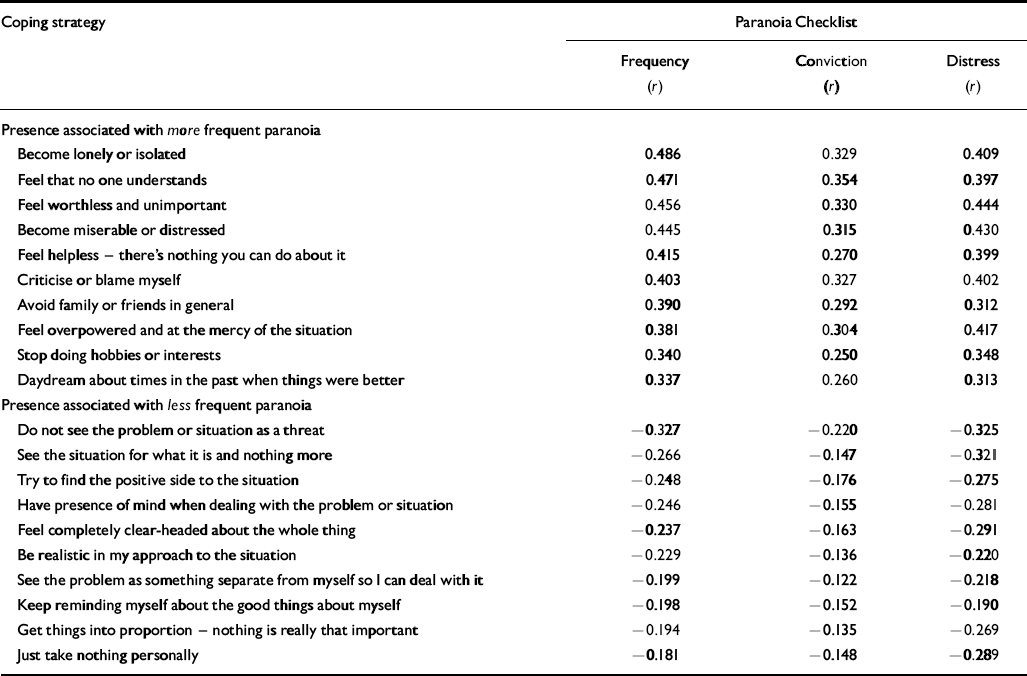
A total of 1046 participants also completed the CSQ. Higher levels of emotional and avoidant coping were associated with higher levels of paranoia (Table 6). In contrast, higher levels of detached coping were associated with lower levels of paranoia. Higher levels of rational coping were associated with lower levels of paranoia frequency and distress, but not significantly with paranoia conviction. In Table 7 we highlight the coping strategies most strongly correlated with paranoia frequency.
Table 6 Coping strategies and paranoia (n=1046)
| Type of coping | Paranoia Checklist | |||||
|---|---|---|---|---|---|---|
| Frequency | Conviction | Distress | ||||
| r | P | r | P | r | P | |
| Emotional | 0.56 | <0.001 | 0.42 | <0.001 | 0.55 | <0.001 |
| Avoidant | 0.33 | <0.001 | 0.24 | <0.001 | 0.28 | <0.001 |
| Detached | -0.25 | <0.001 | -0.14 | <0.001 | -0.33 | <0.001 |
| Rational | -0.17 | <0.001 | -0.06 | 0.06 | -0.20 | <0.001 |
Table 7 Coping strategies most associated with high and low frequencies of paranoia (n=1046)
| Coping strategy | Paranoia Checklist | ||
|---|---|---|---|
| Frequency | Conviction | Distress | |
| (r) | (r) | (r) | |
| Presence associated with more frequent paranoia | |||
| Become lonely or isolated | 0.486 | 0.329 | 0.409 |
| Feel that no one understands | 0.471 | 0.354 | 0.397 |
| Feel worthless and unimportant | 0.456 | 0.330 | 0.444 |
| Become miserable or distressed | 0.445 | 0.315 | 0.430 |
| Feel helpless — there's nothing you can do about it | 0.415 | 0.270 | 0.399 |
| Criticise or blame myself | 0.403 | 0.327 | 0.402 |
| Avoid family or friends in general | 0.390 | 0.292 | 0.312 |
| Feel overpowered and at the mercy of the situation | 0.381 | 0.304 | 0.417 |
| Stop doing hobbies or interests | 0.340 | 0.250 | 0.348 |
| Daydream about times in the past when things were better | 0.337 | 0.260 | 0.313 |
| Presence associated with less frequent paranoia | |||
| Do not see the problem or situation as a threat | -0.327 | -0.220 | -0.325 |
| See the situation for what it is and nothing more | -0.266 | -0.147 | -0.321 |
| Try to find the positive side to the situation | -0.248 | -0.176 | -0.275 |
| Have presence of mind when dealing with the problem or situation | -0.246 | -0.155 | -0.281 |
| Feel completely clear-headed about the whole thing | -0.237 | -0.163 | -0.291 |
| Be realistic in my approach to the situation | -0.229 | -0.136 | -0.220 |
| See the problem as something separate from myself so I can deal with it | -0.199 | -0.122 | -0.218 |
| Keep reminding myself about the good things about myself | -0.198 | -0.152 | -0.190 |
| Get things into proportion — nothing is really that important | -0.194 | -0.135 | -0.269 |
| Just take nothing personally | -0.181 | -0.148 | -0.289 |
Social–cognitive processes and paranoid thoughts
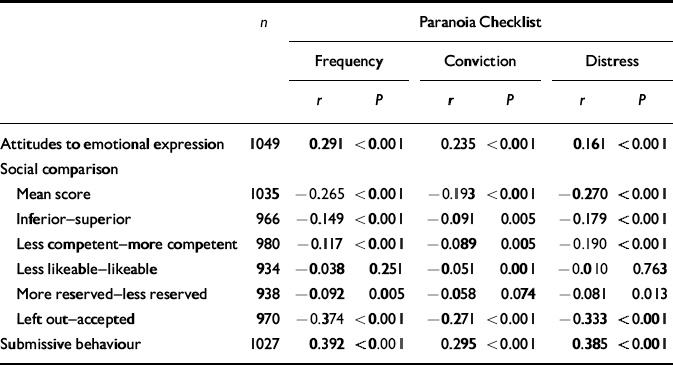
There were significant but generally modest associations between the social–cognitive processes and the dimensions of paranoia. Negative attitudes to emotional expression, lower social comparison (particularly feeling left out) and greater use of submissive behaviours were significantly associated with greater paranoia (Table 8).
Table 8 Social cognitive processes and paranoia
| n | Paranoia Checklist | ||||||
|---|---|---|---|---|---|---|---|
| Frequency | Conviction | Distress | |||||
| r | P | r | P | r | P | ||
| Attitudes to emotional expression | 1049 | 0.291 | <0.001 | 0.235 | <0.001 | 0.161 | <0.001 |
| Social comparison | |||||||
| Mean score | 1035 | -0.265 | <0.001 | -0.193 | <0.001 | -0.270 | <0.001 |
| Inferior—superior | 966 | -0.149 | <0.001 | -0.091 | 0.005 | -0.179 | <0.001 |
| Less competent—more competent | 980 | -0.117 | <0.001 | -0.089 | 0.005 | -0.190 | <0.001 |
| Less likeable—likeable | 934 | -0.038 | 0.251 | -0.051 | 0.001 | -0.010 | 0.763 |
| More reserved—less reserved | 938 | -0.092 | 0.005 | -0.058 | 0.074 | -0.081 | 0.013 |
| Left out—accepted | 970 | -0.374 | <0.001 | -0.271 | <0.001 | -0.333 | <0.001 |
| Submissive behaviour | 1027 | 0.392 | <0.001 | 0.295 | <0.001 | 0.385 | <0.001 |
DISCUSSION
Study limitations
There are methodological constraints that need to be acknowledged when interpreting our results. Foremost, the sample was not epidemiologically representative. It was self-selected, restricted to university students and recruited by e-mail. The gender ratio was certainly skewed, perhaps in consequence of our methods. People who self-select for questionnaires of this type may be more prone to psychological disturbance, or the stigma of appearing so might skew the sample in the opposite direction. Thus, our investigation in a selected group indicates a need for more elaborate and more truly epidemiological studies. There are also issues concerning whether the experiences assessed are actually unfounded; questionnaire studies may include an unknown proportion of paranoia that is realistic and therefore well judged and appropriate. It is also unknown whether any of the participants had received treatment for a psychiatric disorder, and what the level of substance use was in the group. The study was also limited by the cross-sectional questionnaire design, which limits the conclusions that can be drawn concerning the causal direction of the relationships between associated variables.
Hierarchy of paranoia
Our survey clearly indicates that suspicious thoughts are a weekly occurrence for many people: 30–40% of the respondents had ideas that negative comments were being circulated about them and 10–30% had persecutory thoughts, with thoughts of mild threat (e.g. ‘People deliberately try to irritate me’) being more common than severe threat (e.g. ‘Someone has it in for me’). In contrast, only a small proportion (approximately 5%) of respondents endorsed the checklist items that were the most improbable (e.g. that there was a conspiracy). Nevertheless, the rarer and odder suspicions – characteristic of clinical presentations – occurred in tandem with the more common and plausible experiences. The rarer the thought, then the higher the total score indicated by its presence. There has been no previous examination of paranoia in this way.
The findings indicate a hierarchy of paranoia (Fig. 2): the most common type of suspiciousness is that of a social anxiety or interpersonal worry theme; ideas of reference build upon these sensitivities; persecutory thoughts are closely associated with the attributions of significance; as the severity of the threatened harm increases, the less common the thought; and suspiciousness involving severe harm and organisations and conspiracy is at the top of the hierarchy. The implication is that severe paranoia may build upon common emotional concerns, consistent with a recent cognitive model of persecutory delusions (Reference Freeman, Garety and KuipersFreeman et al, 2002; Reference Freeman and GaretyFreeman & Garety, 2004). The interesting questions therefore concern the identification of the additional factors that contribute to the development of severe paranoia and whether there are qualitative shifts in experience at the top end of the hierarchy (note that individuals at the higher end of the hierarchy tended to endorse all their suspicious thoughts with high levels of conviction and distress). The survey findings also indicate that there is a continuous (exponential) distribution of total number of suspicious thoughts in the general population, although the thoughts appear in a hierarchical arrangement. No distinct subpopulation was identified. This therefore demonstrates correspondence to common mental health disorders such as depression and anxiety.
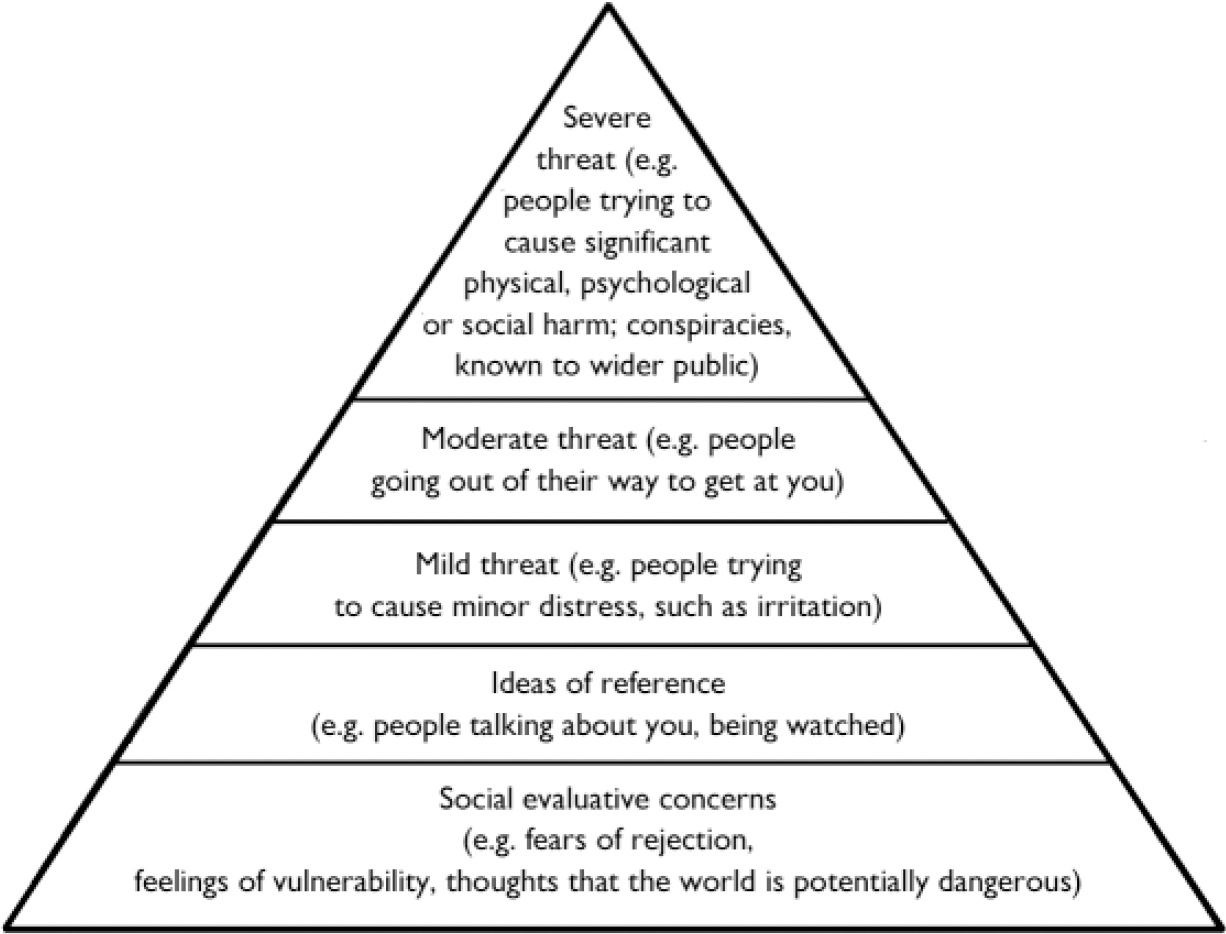
Fig. 2 The paranoia hierarchy.
Interestingly, the ideation captured in this survey did not seem to be restricted to passing thoughts that were dismissed almost in the same instant that they occurred. Approximately 10–20% of the survey respondents held paranoid ideation with strong conviction and significant distress. It is likely that the survey identified a significant group of people who were having distressing experiences that they managed on their own. We believe that there is a reticence in the general population about discussing the occurrence of suspicious thoughts, partly arising from the negative connotations associated with the term paranoia and a lack of recognition of how common these experiences actually are. The provision of the type of information obtained in this survey may help to normalise paranoia and set the stage for making the experience understandable. This is an important element in the development of alternative explanations of experiences (Reference Freeman, Garety and FowlerFreeman et al, 2004).
Coping with paranoid thoughts
If paranoia is an everyday phenomenon, which many people manage well, then it provides an opportunity to gain clinically useful information on optimal ways of coping. More frequent and distressing paranoia was associated with becoming isolated, giving up activities, and feelings of powerlessness and depression. Conversely, less frequent paranoia was associated with not catastrophising and by gaining sufficient (metacognitive) distance to consider the situation dispassionately. More broadly, coping with paranoia may resemble coping with other stressful or negative events: rational (or task-oriented) coping and detachment from the situation are more helpful than emotional or avoidant coping. It is not clear to what extent poor coping encourages paranoia, and to what extent strong paranoia interferes with effective coping.
Social–cognitive factors
There has been a re-emergence of the study of the influence of social factors on psychosis by examining their impact at the cognitive level of explanation (Reference Garety, Kuipers and FowlerGarety et al, 2001). In our survey associations were found between paranoia and social–cognitive processes that could plausibly exacerbate suspiciousness. Thus, we found evidence that not expressing feelings to others may increase suspiciousness. This follows early research on the psychological consequences of the Herald of Free Enterprise ferry disaster, which indicated that negative attitudes to emotional expression in survivors were associated with higher levels of anxiety (Reference Joseph, Dalgleish and WilliamsJoseph et al, 1997).
There was a significant association of paranoia with submissive behaviours. As Allan & Gilbert (Reference Allan and Gilbert1997) note, people who have difficulties in asserting themself – which these authors conceptualise within an evolutionary framework as having low dominance and inferior social rank – can be vulnerable to a number of psychological problems. Further, these authors report that submissiveness is associated with paranoid thoughts and with angry thoughts and feelings. Attributions that others have negative intentions underlie feelings of anger. We think that in some cases anger may contribute to the attribution of intent in persecutory ideation. However, rather than expressing anger or resentment towards others, individuals may instead ruminate and feel aggrieved owing to timidity or submissiveness. This will maintain a state in which external attributions and anomalous experiences are more likely, thus leading to the persistence of persecutory ideation.
We also found that respondents who felt left out, inferior or less competent in relation to others displayed higher levels of suspiciousness. Birchwood et al (Reference Birchwood, Meaden and Trower2000) reported a connection between social comparison and the experience of hearing voices. We suggest that a lack of social self-confidence might make people feel vulnerable to attack and hence contribute to the occurrence of paranoia. This is consistent with experimental evidence that interpersonal sensitivity predicts persecutory ideation (Reference Freeman, Slater and BebbingtonFreeman et al, 2003). It is of note, however, that in our study the associations of paranoia with many of the variables were of small to medium effect size. This is unsurprising, and is consistent with the view that paranoia is a complex phenomenon likely to arise from a number of social, cognitive and biological factors.
Interventions for paranoid thoughts
Our study has practical implications for clinical interventions in paranoia. Interventions may be more effective if they include recognition of the ubiquity of suspiciousness; encourage talking about such experiences with others; improve self-esteem; help people in negotiating relationships with others; and encourage detachment and feelings of control over the situation. These are all central components of cognitive–behavioural interventions for psychosis (e.g. Reference Fowler, Garety and KuipersFowler et al, 1995; Reference Chadwick, Birchwood and TrowerChadwick et al, 1996).
Clinical Implications and Limitations
CLINICAL IMPLICATIONS
-
▪ Having suspicious thoughts is a common experience and provision of this information may help reduce patient distress.
-
▪ Feelings of hopelessness and lack of control may contribute to the occurrence of more suspicious thoughts, whereas gaining distance from such thoughts and evaluating them may reduce such experiences.
-
▪ Not talking to others about suspicious thoughts, feeling vulnerable and behaving timidly with others may be factors in the development of paranoia.
LIMITATIONS
-
▪ An epidemiologically representative sample was not recruited.
-
▪ The group mainly comprised young adults who may have higher rates of suspiciousness.
-
▪ Only cross-sectional associations between paranoia, coping strategies and social–cognitive processes were examined.
Acknowledgements
This work was supported by a programme grant from the Wellcome Trust (no. 062452). We thank the participants from the three universities.



eLetters
No eLetters have been published for this article.