Research has shown that mental health and the use of mental health services frequently varies by ethnic origin. Studies of depression and anxiety Reference Weich, Nazroo, Sproston, McManus, Blanchard and Erens1–Reference Nazroo3 and psychoses, such as schizophrenia, Reference Nazroo3–Reference Reeves, Sauer, Stewart, Granger and Howard6 and suicide Reference Raleigh7,Reference McKenzie, Bhui, Nanchahal and Blizard8 reflect this. The causes of these differences are controversial, but are mainly attributed to inadequate access to health and social services, Reference Nazroo3,Reference Williams9,Reference Nazroo10 low socioeconomic resources, poor standards of living Reference Nazroo3,Reference Williams9,Reference Nazroo10 and the overrepresentation of minorities in deprived areas characterised by poor educational, housing and employment conditions. Reference Platt11–Reference Acevedo-Garcia and Lochner14
However, as early as 1939, Faris & Dunham Reference Faris and Dunham15 reported that the Black population living in Chicago had unexpectedly low rates of admission when living in predominately Black areas, despite the fact that these areas were particularly deprived, and counter to the fact that admissions rates for White people in these areas were high. The phenomenon whereby the health of ethnic minority individuals is better when they live in areas with more people of the same ethnicity is known as the ‘ethnic density effect’. A positive, or ‘protective’, effect of ethnic density on mental health may indicate the power of beneficial psychosocial influences derived from enhanced social capital, better social integration, mitigated racism and diminished stigma, to override the detrimental effects of material deprivation at the area level.
The evidence for or against ethnic density effects seems to vary depending on the ethnic minority group analysed, and on the measure of mental health used. Previous reviews of ethnic density effects on health have not systematically searched for studies Reference Halpern16,Reference Pickett and Wilkinson17 and therefore their conclusions may be biased by the selection of studies. In this narrative review we aim to systematically identify all of the literature that has investigated the mental health of ethnic minorities in relation to the ethnic density of the areas in which they reside, in order to answer the question: do individuals from ethnic minority groups have better mental health when they live in areas with a higher density of people of the same ethnicity?
Method
Data sources and search terms
The following databases were searched from their earliest date (given in parenthesises) until January 2011: Medline (1950), PsycINFO (1806), Sociological Abstracts (1952), and the Science (1900) and Social Science Citation (1996) indices of the Web of Science. To ensure no key papers were missed, we also searched through the reference lists of papers we identified.
Our search strategy was developed after a preliminary pilot search. To optimise the trade-off between sensitivity and specificity, different terms were used for different databases. For Medline and PsychINFO, which have a specific focus on health, we searched only for ethnic density-related phrases, such as ‘ethnic enclave’, ‘racial segregation’ and combinations of neighbourhood and ethnicity terms such as ‘ethnic*’ OR ‘Hispanic’. For the other databases that were not health focused, we included health terms such as ‘Depression’ or ‘Distress’ to improve specificity (see the online supplement for a full list of terms).
Study inclusion criteria
The inclusion criteria were: (a) the study was published in a journal or book; (b) the sample contained an ethnic minority group of adults or adolescents; (c) the study included a measure of ethnic density, measured at a geographical scale smaller than a US state or a nation state; (d) the study included a measure of mental health, disorder or illness as an outcome. In order to accommodate variations in the definitions of mental disorders and illnesses across time and cultures, the eligibility of an outcome was dependent on the concepts and definitions utilised by the authors who developed or validated the instrument or methodology used to assess an outcome.
Procedures and data extraction
The results of the search were downloaded into Procite 5 (Thompson Scientific, Stamford, Connecticut, USA; www.procite.com/pcinfo.asp) on Windows. To handle the large number of hits, titles and abstracts were viewed on screen (by R.J.S.). Those that did not meet the inclusion criteria were excluded. Copies were obtained of the remaining papers. These papers were then reviewed (R.J.S.) and doubts about inclusion referred for a second opinion (K.E.P.).
For each article meeting the inclusion criteria, two reviewers (R.J.S. and either L.B. or C.B.A.) extracted data on study population (age, sample size, location, recruitment method), ethnicity, ethnic density (geographic area size, classification of ethnicity, range), mental health outcome, confounding factors, statistical methods and results.
Measurement of ethnic density
Measures of ethnic density fell into two categories. First, researchers analysed the impact of ‘same-ethnic density’ on the health of specified ethnic groups. This included, for example, examining the association between the proportion of African American residents in a neighbourhood and the health of African American individuals. Second, researchers used measures of ethnic density that combined multiple ethnic groups (in other words ‘overall-ethnic density’) such as the proportion of Black and minority ethnic residents or the proportion of people belonging to ‘visible minorities’ (in the text of our review, where it is not ambiguous, we retain the terminology used to categorise race and ethnicity in the original research papers). In UK-based studies, the proportion of South Asian residents was a measure of ethnic density frequently used to examine effects on individuals of Pakistani, Indian and Bangladeshi origin.
Analysis
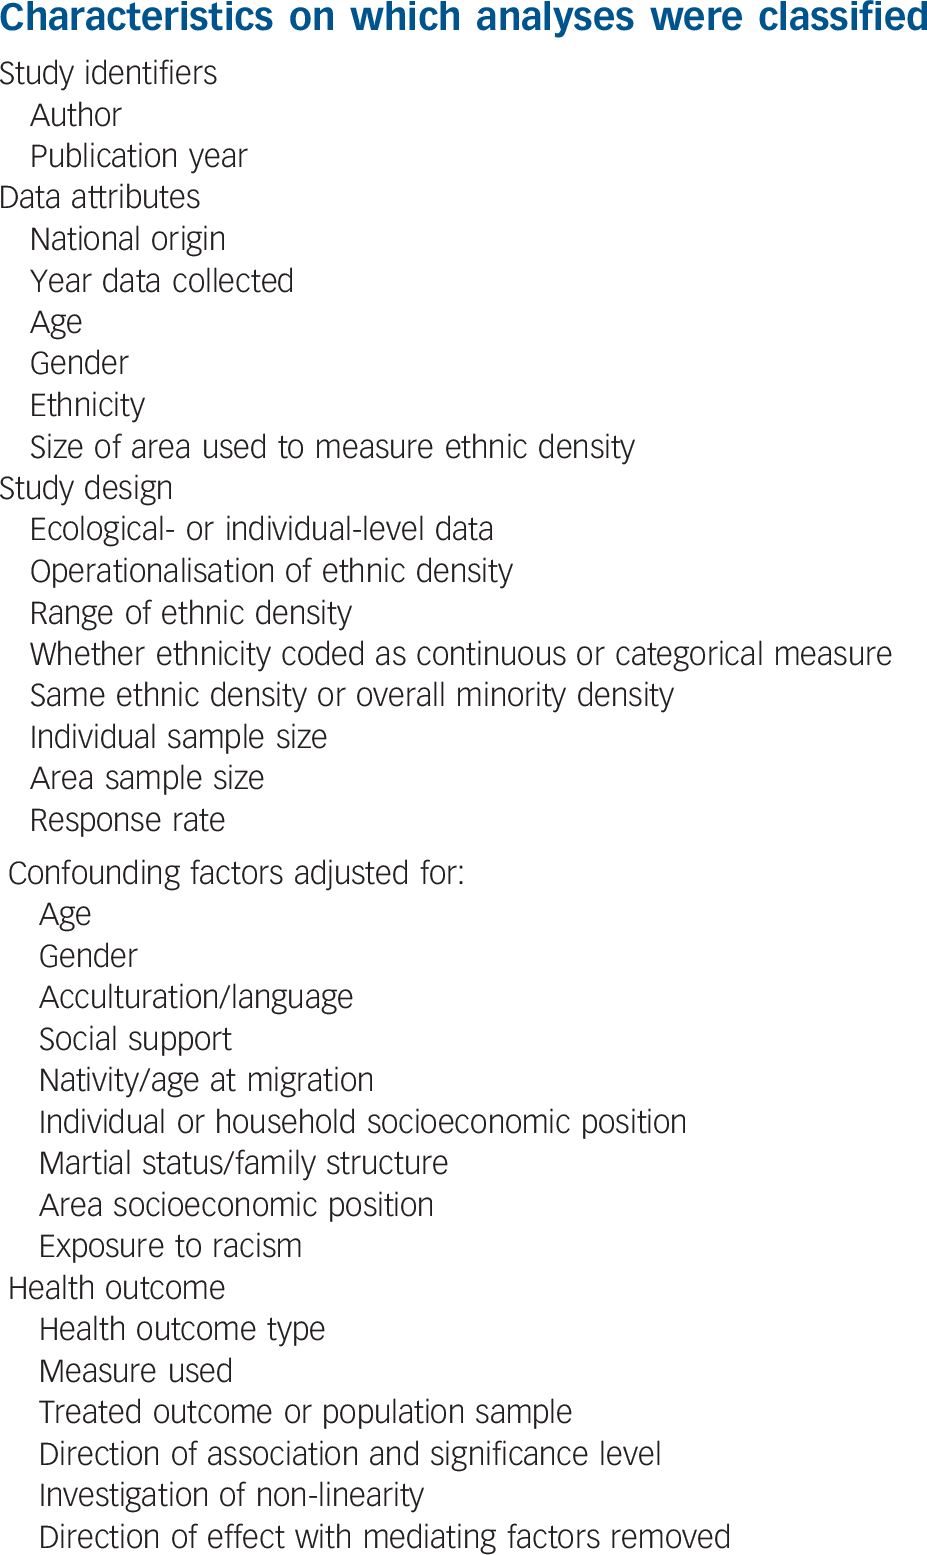
Results from a single data-set that were presented in more than one published paper were considered to be from the same study. However, within each study, there were often multiple independent analyses of ethnic density associations. For example, if a study analysed two different ethnic minority groups separately, and further stratified analyses by gender, then repeated analyses for two different outcomes, its findings are represented in figures for eight separate analyses. In total, there were 137 independent analyses. These independent analyses varied on over 30 characteristics that from theory we expected might explain the study results (Appendix). These characteristics included a wide range of ethnic and demographic groups, measurement of ethnic density (and ethnicity) in different ways and at different area levels, a use of a wide variety of statistical methodology and adoption of different approaches to adjust for confounding variables, in addition to employing many different definitions of mental health disorders. It soon became apparent that many aspects of the study confounded each other and a narrative synthesis was the most appropriate way to analyse the data.
We have supplemented our narrative synthesis with figures of ‘tree maps’. These tree maps are semi-quantitative visual syntheses of the independent analyses. In these figures each analysis is represented by a box that is shaded depending on result, which indicates whether the analysis finds a significant association with ethnic density that is adverse, protective or neutral (no significant association). The size of the box reflects the approximate size of the ethnic minority sample, specifically whether the sample size is more than 4000, 1000–4000, 500–1000, or less than 500 (analyses with unclear sample sizes are represented in the same way as those with a sample size under 500). These figures may aid the reader in understanding the weight of the evidence, but it is not our intention for them to be taken as equivalent to quantitative meta-analysis techniques, as they are used here predominantly to simplify the complexity of the information for the reader.
Given the lack of clarity in how data were collected, the broad and sometimes inconsistent use of terms when describing mental disorders, ethnic density and more generally, ethnicity, we decided it would be inappropriate, and potentially misleading, to present this as a systematic review. Our intent, therefore, is to offer a more contextual analysis with the aid of semi-quantitative visualisations in the form of tree maps.
Results
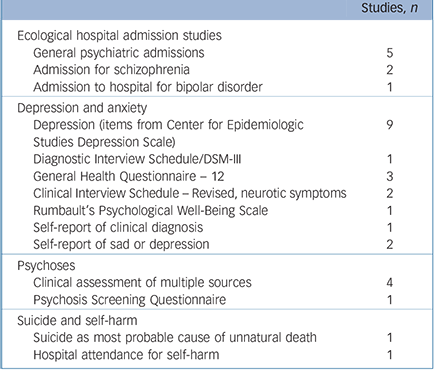
The electronic search identified 7378 titles. From these, 365 papers were obtained for further inspection (2 papers were excluded as they could not be obtained via the British Library) and 6 papers that were not detected by the electronic search were identified from references. The analytic sample included 34 papers based on 29 studies (Fig. 1). In total, seven ecological studies Reference Cochrane and Bal18–Reference Rabkin24 were found, all of which examined the association of ethnic density with the use of mental health services or admittance to hospital for mental health conditions. Among the studies using multilevel data, 16 studies (19 papers) focused on depression and anxiety, Reference Abada, Hou and Ram25–Reference Yuan43 5 studies (7 papers) examined psychoses, Reference Halpern and Nazroo29,Reference BeAcares, Nazroo and Stafford44–Reference Veling, Susser, van Os, Mackenback, Selten and Hoek49 and 2 studies investigated suicide or self-harm. Reference Neeleman and Wessely50,Reference Neeleman, Wilson-Jones and Wessely51 One study included both anxiety and psychoses as outcomes. Reference Halpern and Nazroo29,Reference Shields and Wailoo37 The number of studies and types of outcome measures used are reported in Table 1.
The results of all of the independent analyses are grouped by sample size and presented together in Fig. 2. The sample size refers to the individual-level analytic sample for each ethnic minority group investigated. Ecological studies and other studies that did not report sample size at the level of the individual are included in the unclear category. Results are most likely to be neutral when sample sizes are smaller. For example, a large majority of analyses have neutral findings when the sample size is smaller than 500. In contrast, when sample sizes are between 1000 and 4000, there are an almost equal number of analyses that have results supporting neutral and protective ethnic density associations. For sample sizes over 4000, the majority of analyses support protective ethnic density effects. Although this figure does not reveal other methodological differences between analyses, it appears that statistical power may be particularly important in identifying significant associations between ethnic density and mental health measures, possibly because of the subtlety of such associations.
What follows is our narrative synthesis of results supplemented with tree maps, and organised by the type of mental health measure: ecological studies, depression and anxiety, psychoses, and suicide and self-harm.
Ecological studies
Among the ecological studies, all analyses examined the association between ethnic density and area-level rates of hospital admissions. Five studies looked at general psychiatric admissions, Reference Klee, Spiro, Bahm and Gorwitz19–Reference Levy and Rowitz21,Reference Muhlin23,Reference Rabkin24 two looked at admissions for schizophrenia, Reference Cochrane and Bal18,Reference Mintz and Schwartz22 and one also looked at admissions for bipolar disorder. Reference Mintz and Schwartz22 There was great variability between the studies in population, study design and methods (online Table DS1). All but one study (published in 1988) Reference Cochrane and Bal18 were published before 1980 and only one Reference Mintz and Schwartz22 adjusted for area-level socioeconomic status. Reference Mintz and Schwartz22
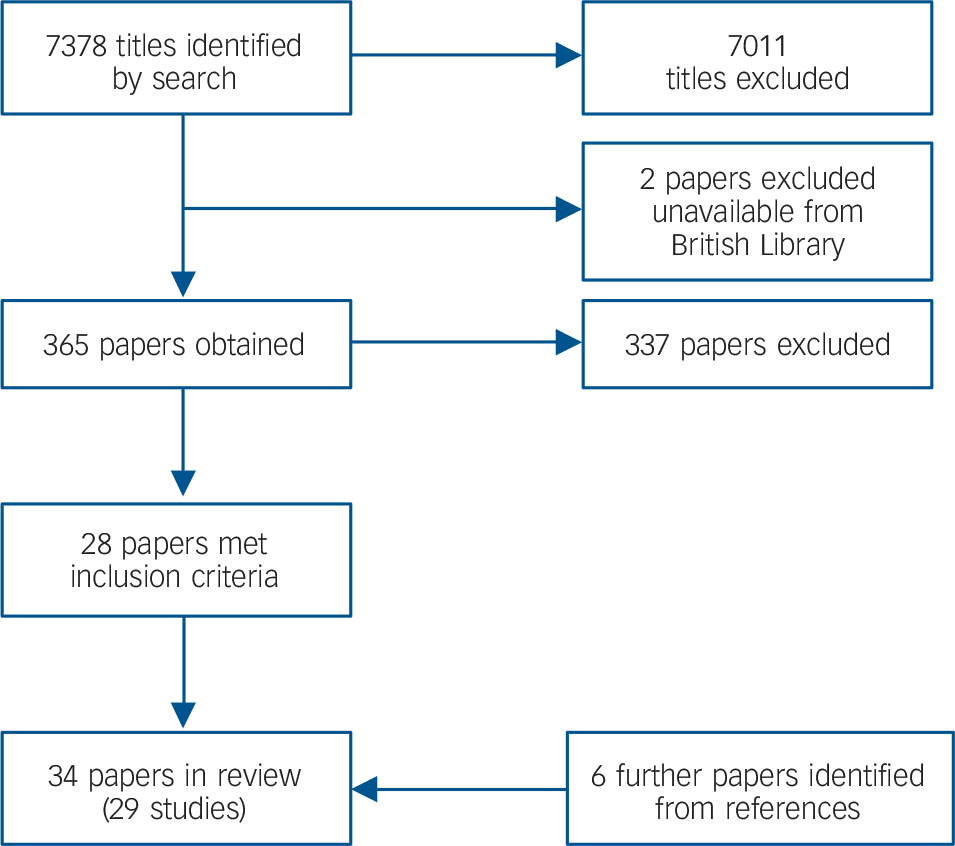
FIG. 1 Flow diagram showing review process.
As can be inferred from Fig. 3, US studies provided the most consistent support for an ethnic density effect. Reference Klee, Spiro, Bahm and Gorwitz19,Reference Levy and Rowitz21–Reference Rabkin24 All found a protective association of ethnic density with admission rates among the ethnic minority groups sampled in the studies, which included Black Reference Levy and Rowitz21,Reference Rabkin24 and Puerto Rican people, Reference Rabkin24 groups of European origin Reference Mintz and Schwartz22,Reference Muhlin23 and the ‘non-White’ population in general. Reference Klee, Spiro, Bahm and Gorwitz19 Outside the USA, findings are less consistent. A UK-based study of ethnic density, exploring hospital admissions for schizophrenia of four different ethnic groups (Irish, Indian, Pakistani and Caribbean) found a significant protective association with higher ethnic density only for Irish men. Reference Cochrane and Bal18 Similarly, an Australian study of people of Greek and Italian origin in three time periods found a protective association with higher same-ethnic density only for Greek women between 1965 and 1970. Reference Krupinski20 However, in the Australian study, the threshold for high same-ethnic density was >5%, and the UK study did not report ethnic density levels. It is, therefore, possible that neither study included samples living at same-ethnic densities high enough to offer any health benefit.
TABLE 1 Summary of measures used in included studies
| Studies, n | |
|---|---|
| Ecological hospital admission studies | |
| General psychiatric admissions | 5 |
| Admission for schizophrenia | 2 |
| Admission to hospital for bipolar disorder | 1 |
| Depression and anxiety | |
| Depression (items from Center for Epidemiologic Studies Depression Scale) | 9 |
| Diagnostic Interview Schedule/DSM-III | 1 |
| General Health Questionnaire – 12 | 3 |
| Clinical Interview Schedule – Revised, neurotic symptoms | 2 |
| Rumbault's Psychological Well-Being Scale | 1 |
| Self-report of clinical diagnosis | 1 |
| Self-report of sad or depression | 2 |
| Psychoses | |
| Clinical assessment of multiple sources | 4 |
| Psychosis Screening Questionnaire | 1 |
| Suicide and self-harm | |
| Suicide as most probable cause of unnatural death | 1 |
| Hospital attendance for self-harm | 1 |
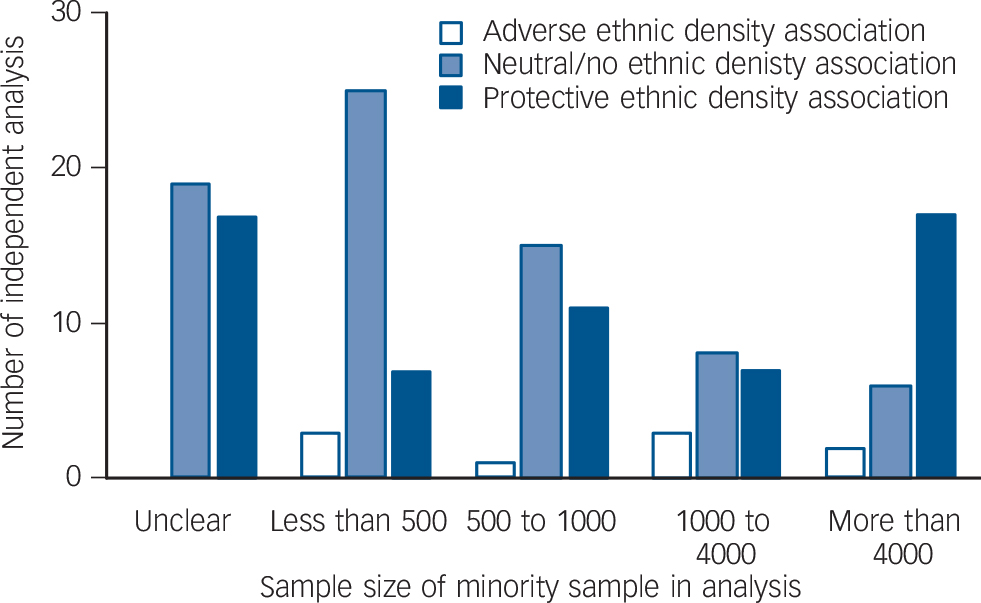
FIG. 2 Bar chart showing the number of independent analyses by direction of association and sample size of the analysis.
Depression and anxiety
Sixteen data-sets investigated the association between ethnic density and rates of depression or anxiety Reference Abada, Hou and Ram25–Reference Yuan43 (online Table DS2). All these studies used multilevel data, however, four studies did not account for the multilevel structure or clustering of the data. Reference Ecob and Williams28,Reference Halpern and Nazroo29,Reference Oliver33,Reference Shields and Wailoo37,Reference Ying and Akutsu42
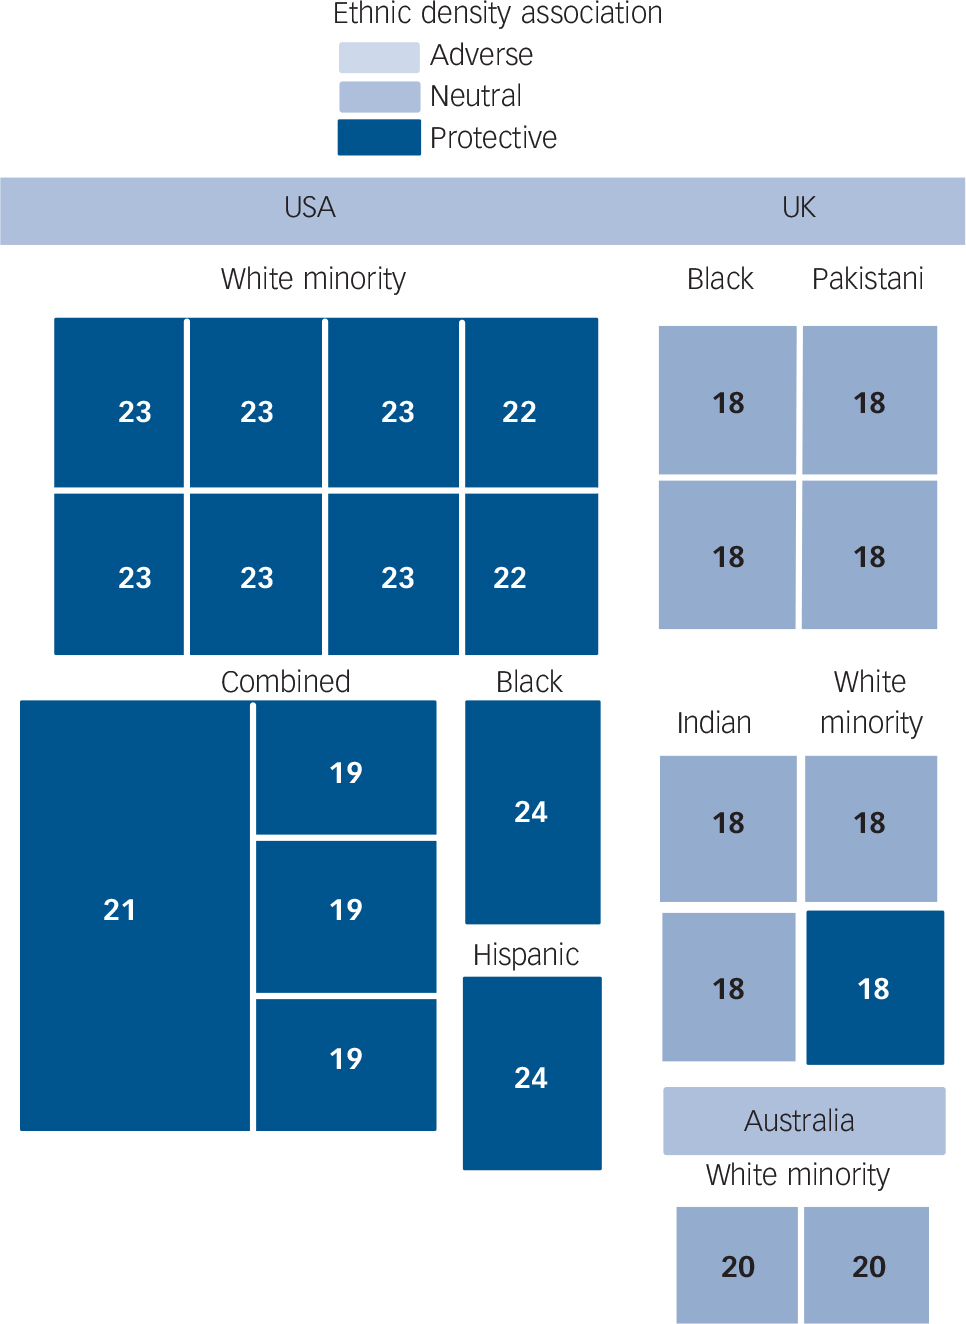
FIG. 3 Tree map showing all independent analyses from ecological studies as boxes, labelled with reference number of paper of origin, scaled by sample size and shaded by result of ethnic density association (details in text).
Among the 11 North American studies, 10 were of US populations, Reference Aneshensel, Wight, Miller-Martinez, Botticello, Karlamangla and Seeman26,Reference Henderson, Diez Roux, Jacobs, Kiefe and Williams30–Reference Ostir, Eschbach, Markides and Goodwin34,Reference Tweed, Goldsmith, Jackson, Stiles, Rae and Kramer38–Reference Wight, Cummings, Karlamangla and Aneshensel41,Reference Yuan43 and 1 Canadian. Reference Abada, Hou and Ram25 The majority of these studies investigated Black and Hispanic samples (Fig. 4). Of these North American studies that examined the association between overall-ethnic density and depression, Reference Abada, Hou and Ram25,Reference Henderson, Diez Roux, Jacobs, Kiefe and Williams30,Reference Oliver33,Reference Wickrama, Noh and Bryant39,Reference Wight, Aneshensel, Botticello and Sepulveda40 two reported a significant association. Both of these were studies of adolescents aged between 12 and 19. Reference Abada, Hou and Ram25,Reference Wickrama, Noh and Bryant39,Reference Wight, Aneshensel, Botticello and Sepulveda40 In one of these studies, based in Canada, overall-ethnic density had an adverse association with the mental health of ‘visible minority’ adolescents. Reference Abada, Hou and Ram25 A visible minority person is defined under Canada's Employment Act as being a person who is neither White nor of aboriginal origin. Reference Abada, Hou and Ram25 In the other study, based in the USA, overall-ethnic density also had non-significant adverse associations with the number of depressive symptoms of Hispanic and Asian/Pacific Islander adolescents, Reference Wight, Aneshensel, Botticello and Sepulveda40 but among African American adolescents, this association was reversed – overall-ethnic density was protective against depressive symptoms. Reference Wickrama, Noh and Bryant39,Reference Wight, Aneshensel, Botticello and Sepulveda40
Among US adults, there is evidence that same-ethnic density had a protective association with depression and anxiety. Two Reference Tweed, Goldsmith, Jackson, Stiles, Rae and Kramer38,Reference Yuan43 out of seven studies of same-ethnic density among Black people in the USA found such protective associations. However, one of these studies found the reverse association. Reference Mair, Diez Roux, Osypuk, Rapp, Seeman and Watson32 Two Reference Ostir, Eschbach, Markides and Goodwin34,Reference Ostir, Eschbach, Markides and Goodwin34 out of five studies of same-ethnic density among Hispanic people found protective associations. In addition, there is some evidence that ethnic density may protect against depression for Hispanic people living in socioeconomically disadvantaged communities. Reference Wight, Cummings, Karlamangla and Aneshensel41 A possible explanation for the lack of consistent protective associations for Hispanic people is sample size; two of the studies of Hispanic people included very small samples at the individual level, Reference Aneshensel, Wight, Miller-Martinez, Botticello, Karlamangla and Seeman26,Reference Wight, Cummings, Karlamangla and Aneshensel41,Reference Yuan43 and a third study contained a large sample of individuals, but few areas. Reference Wight, Aneshensel, Botticello and Sepulveda40 It is less clear why there is some discrepancy in the findings among Black people, especially regarding the adverse association found in one study Reference Mair, Diez Roux, Osypuk, Rapp, Seeman and Watson32 that contrasts with other studies that found protective associations.

FIG. 4 Tree map showing all independent analyses from studies of depression and anxiety as boxes, labelled with reference number of paper of origin, scaled by sample size and shaded by result of ethnic density association (details in text).
The majority of UK-based studies investigated Black or South Asian samples (Fig. 4). Two studies that combined ethnic minority groups found protective associations with overall-ethnic density. Reference Das-Munshi, Becares, Dewey, Stansfeld and Prince27,Reference Halpern and Nazroo29 Another similar study found that the adverse association between overall-ethnic density and common psychiatric symptoms among White people was not found among a mixed sample of ethnic minorities, although it was not clear whether the association was reversed. Reference Propper, Jones, Bolster, Burgess, Johnston and Sarker36
Among studies that looked specifically at South Asian people, a study in Glasgow found that South Asian people were marginally less likely to have experienced depression and had fewer psychiatric symptoms when living in areas of higher same-ethnic density. Reference Ecob and Williams28 However, studies that looked at specific groups within the South Asian category revealed some inconsistencies. For example, one study found a significant protective association with same-ethnic density for people of Indian origin, a non-significant protective association for Bangladeshi and African–Asian people, and a non-significant adverse association for people of Pakistani origin. Reference Halpern and Nazroo29 In another study, protective associations were found for Bangladeshi, but not for Pakistani or Indian people. Reference Das-Munshi, Becares, Dewey, Stansfeld and Prince27 In yet another study, protective associations were found for Pakistani and Indian mothers, but an adverse association was found among Bangladeshi mothers. Reference Pickett, Shaw, Atkin, Kiernan and Wilkinson35 However, in this latter study, a very high proportion of the Bangladeshi sample was living in the most deprived areas in the UK. This may have rendered statistical adjustment for area deprivation less effective, or alternatively, the finding may indicate a deprivation threshold beyond which protective ethnic density effects are no longer important.
Four papers investigated outcomes related to depression and anxiety among Black people in the UK. Only one of these studies found that ethnic density was protective. Reference Halpern and Nazroo29 It must be noted, however, that investigations of the ethnic density effect among Black people in the UK should not be directly compared with US studies. This is because the levels of Black ethnic density in the UK are typically very low, in contrast to US levels. If there is such a threshold of ethnic density where protective effects start to be measurable, it may be the case that UK levels for Black people are below this threshold.
Psychoses
Five studies investigated the association between ethnic density and psychoses, Reference Halpern and Nazroo29,Reference BeAcares, Nazroo and Stafford44–Reference Veling, Susser, van Os, Mackenback, Selten and Hoek49 using four data-sets from the UK and one from The Netherlands (online Table DS3). All but one study Reference Schoefield, Ashworth and Jones48 included analyses of the association between overall-ethnic minority density and psychoses among a combined sample of ethnic minority groups. Two studies Reference Kirkbride, Morgan, Fearon, Dazzan, Murray and Jones46,Reference Kirkbride, Boydell, Ploubidis, Morgan, Dazzan and Mckenzie47,Reference Veling, Susser, van Os, Mackenback, Selten and Hoek49 also investigated overall-ethnic density associations for specific ethnic minority groups, and another two Reference Halpern and Nazroo29,Reference BeAcares, Nazroo and Stafford44,Reference Schoefield, Ashworth and Jones48 investigated same-ethnic density associations for specific ethnic minority groups.
Overall-ethnic density was consistently protective for the combined ethnic minority samples, although in one study, the protective associations were restricted to schizophrenia and not found among non-affective psychoses. Reference Kirkbride, Morgan, Fearon, Dazzan, Murray and Jones46,Reference Kirkbride, Boydell, Ploubidis, Morgan, Dazzan and Mckenzie47 The two studies that investigated overall-ethnic density associations for specific groups had different results. In the UK study no ethnic density associations were found for any of the specific ethnic minority groups, which included ‘Black – Caribbean’, ‘Black – African’, ‘Asian’, ‘Mixed ethnicity’, ‘White – other’ and ‘other ethnic groups’. Reference Kirkbride, Morgan, Fearon, Dazzan, Murray and Jones46 However, in the Dutch study, higher overall-ethnic density was protective for psychoses among those of Moroccan ethnicity but not those of Surinamese or Turkish origin. Reference Veling, Susser, van Os, Mackenback, Selten and Hoek49 The studies that investigated same-ethnic density associations for specific ethnic minority groups found similar results. Reference Halpern and Nazroo29,Reference BeAcares, Nazroo and Stafford44,Reference Schoefield, Ashworth and Jones48 Ethnic density was found to be protective for people of Indian and Bangladeshi origin, Reference Halpern and Nazroo29,Reference BeAcares, Nazroo and Stafford44 as well as for Black people. Reference Schoefield, Ashworth and Jones48 The one contrasting finding was that, in one study, ethnic density was associated with increased risk of psychotic symptoms among Pakistani people (indicated by the single light-blue box in Fig. 5). Reference BeAcares, Nazroo and Stafford44 However, as with the study of depression and anxiety in the Bangladeshi sample, Reference Pickett, Shaw, Atkin, Kiernan and Wilkinson35 the Pakistani sample in this contrasting study of psychoses was mostly living in the most deprived category of neighbourhood.
Suicide and self-harm
One paper investigated the association between ethnic density and suicide Reference Neeleman and Wessely50 and another on self-harm Reference Neeleman, Wilson-Jones and Wessely51 (Fig. 6 and online Table DS4). Both studies were conducted in south London, and both included samples of African–Caribbean and Asian ancestry. Higher ‘non-White’ density was protective against suicide for the two ethnic groups combined, and similar associations were found for same-ethnic density, although these associations were not statistically significant. Reference Neeleman and Wessely50 In the study of self-harm, higher ‘non-White’ density was associated with an increased risk of self-harm in one hospital catchment area but not another. Reference Neeleman, Wilson-Jones and Wessely51 For those of African–Caribbean origin, higher same-ethnic density was also associated with self-harm in one hospital catchment area, but for Asian people higher same-ethnic density was protective in both areas.
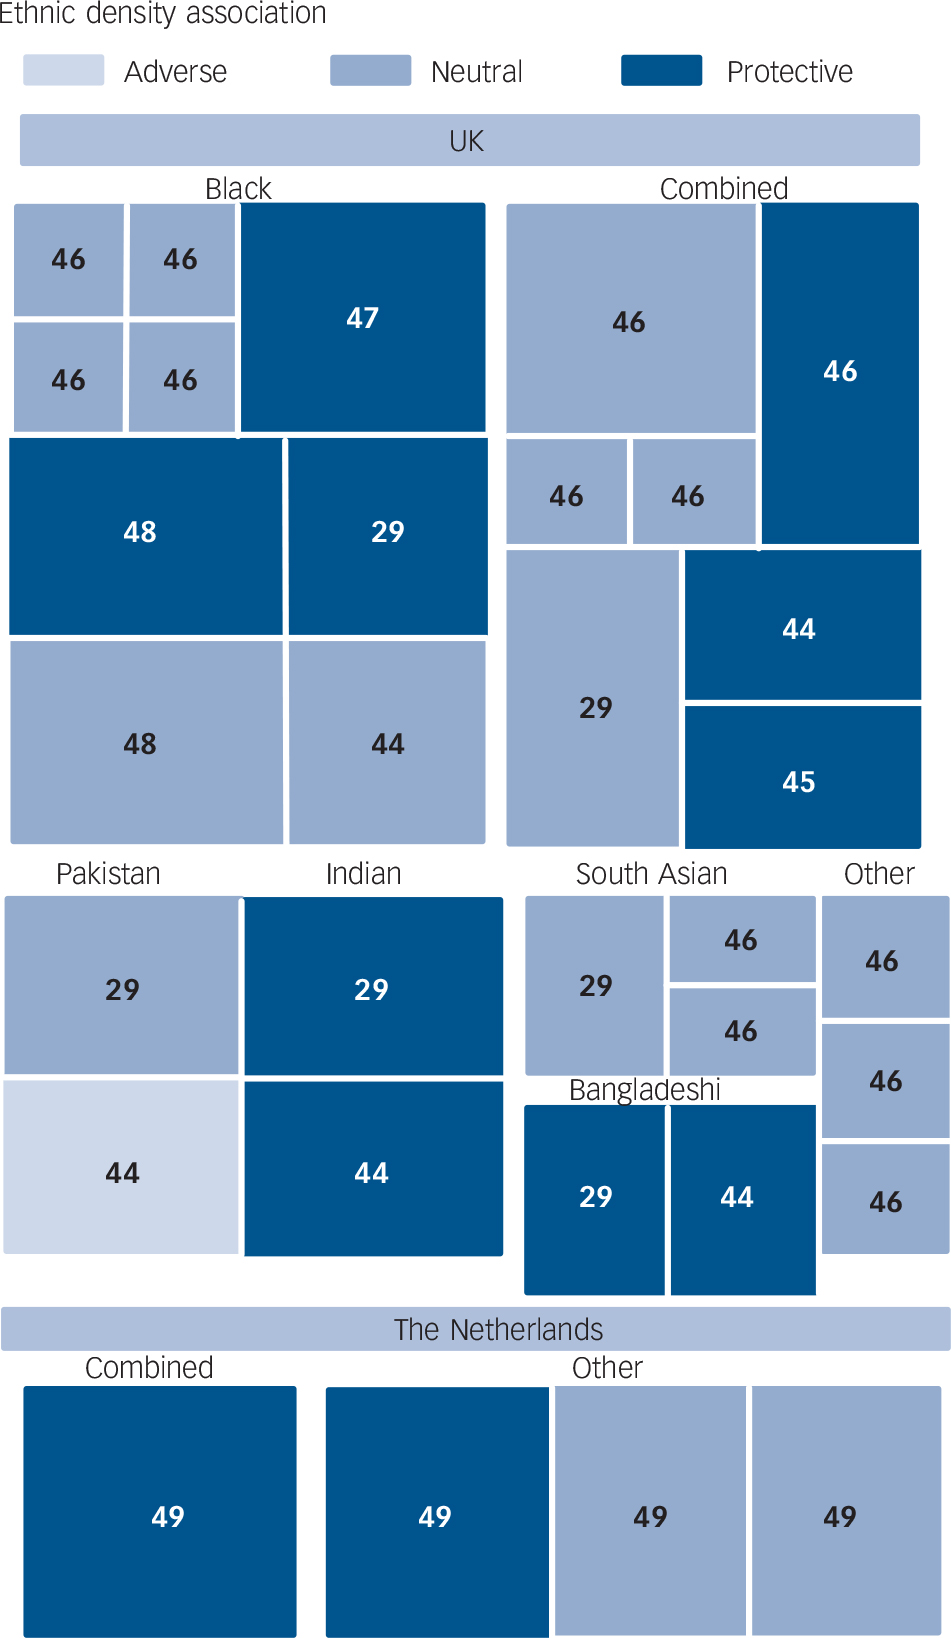
FIG. 5 Tree map showing all independent analyses from studies of psychoses as boxes, labelled with reference number of paper of origin, scaled by sample size and shaded by result of ethnic density association (details in text).
Discussion
Older ecological studies from the USA provide the most consistent evidence of a protective association between ethnic density and mental health as can be quickly ascertained by visually inspecting Figs 3 and 7. Findings are less consistent in more recent multilevel studies. Among multilevel studies of depression and anxiety in the USA, there is some evidence for a protective association with ethnic density among Black and Hispanic adults and among Black adolescents. However, Hispanic and East Asian adolescents in the USA, and those belonging to ‘visible minorities’ in Canada, seem to have higher levels of depression at higher ethnic densities. Studies of depression and anxiety in the UK also have somewhat mixed results. Despite this, the majority of analyses of depression and anxiety in both the UK and the USA had results that either supported neutral or protective ethnic density effects, as can be inferred by visual inspection of Fig. 7. This is an especially important finding when considering that statistical power may have been an issue in most of the studies owing to the typically small sample sizes of ethnic minority groups. Among the analyses of psychoses, sample sizes are, on average, larger than among analyses of depression and anxiety. This may be a reason why analyses of psychoses more consistently find a protective association with ethnic density. Analyses of suicide and self-harm also found protective associations, although with only two studies, both from south London, the evidence from this particular mental health measure must be interpreted with caution.
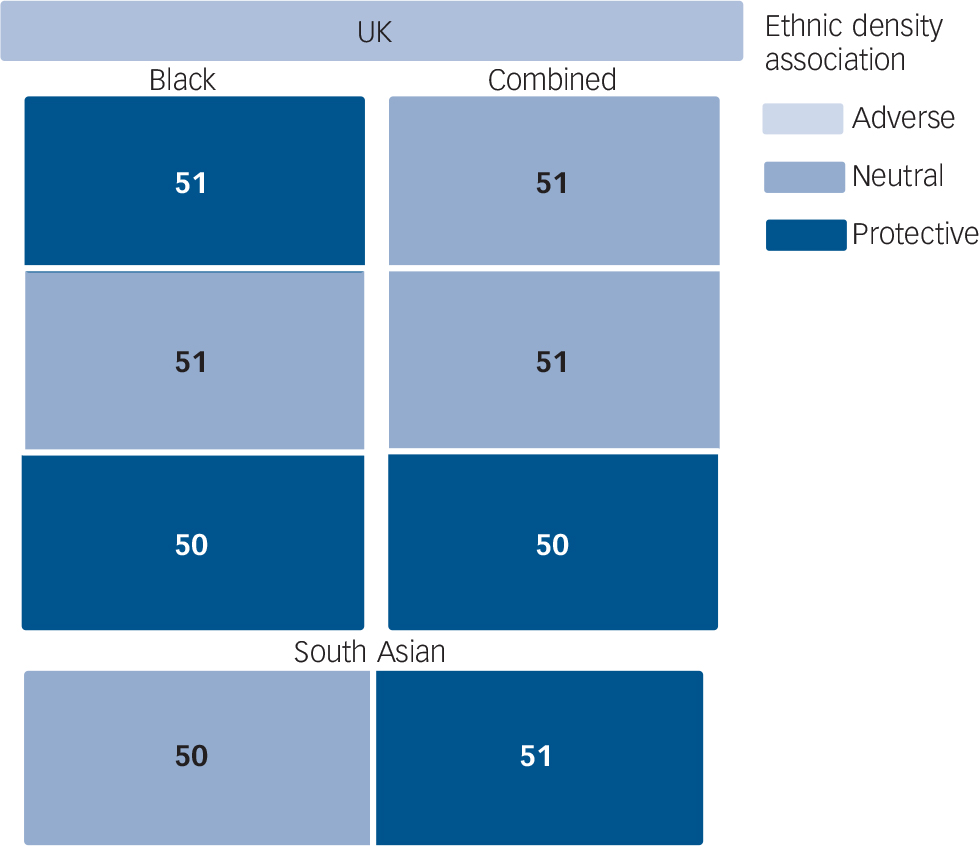
FIG. 6 Tree map showing all independent analyses from studies of suicide and self-harm as boxes, labelled with reference number of paper of origin, scaled by sample size and shaded by result of ethnic density association (details in text).
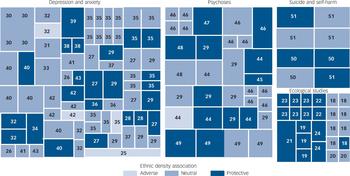
FIG. 7 Tree map showing all independent analyses from all studies as boxes, labelled with reference number of paper of origin, scaled by sample size, and shaded by result of ethnic density association (details in text).
Possible mechanisms of the ethnic density effect
Our aim for undertaking this review was to determine the current state of understanding of ethnic density effects, initially to see whether there is supporting evidence for protective effects. Having found considerable support for such protective ethnic density effects, albeit mostly in the form of significant cross-sectional associations and interaction terms, it is also of interest to explore how ethnic minority groups might benefit from ethnic density. This is because making sense of ethnic density effects may provide further insight into psychosocial pathways, as these studies offer a unique way in which to disentangle psychosocial influences from the effects of material factors. Reference Pickett and Wilkinson17 Countering the adverse material effects of deprived areas, often where ethnically dense communities are found, mental health benefits may be derived from enhanced social support, mitigated racism, positive identity and higher self-evaluation. However, it must be noted that these are theoretical mechanisms, and they have received very little investigation in the context of ethnic density.
Only two studies in this review explicitly examined the role of social support. Reference Das-Munshi, Becares, Dewey, Stansfeld and Prince27,Reference Yuan43 For both studies, protective associations were found between ethnic density and mental health. In one, Reference Yuan43 taking into account social support partially attenuated the protective association with ethnic density. However, in the other, Reference Das-Munshi, Becares, Dewey, Stansfeld and Prince27 social support did not attenuate the association, although the measure of social support in this study was not related to the neighbourhood. It would be of interest to find whether ethnic density effects can be attributed to improved area-level measures of social support, as indicated by such measures of social capital as neighbourhood trust, reciprocity and social networks. Reference Islam, Merlo, Kawachi, LindstroUm and Gerdtham52,Reference Walker and Coulthard53
In only one study Reference BeAcares, Nazroo and Stafford44 was it found that the protective association of ethnic density with mental health became non-significant when racism was taken into account. However, as there is a large body of evidence linking racism and health, this is an important finding. Reference Paradies54,Reference BeAcares, Stafford and Nazroo55 Importantly, the results of this review would suggest that ethnic density may reduce exposure to racism by dispelling prejudices rather than reducing contact between ethnic groups. This is because ethnic density was found to be protective not only in studies in which a high ethnic density indicated areas of homogenous ethnic composition Reference Klee, Spiro, Bahm and Gorwitz19,Reference Levy and Rowitz21,Reference Rabkin24,Reference Ostir, Eschbach, Markides and Goodwin34 but also in studies in which the highest ethnic densities were still less than 50%. Reference Mintz and Schwartz22,Reference Ecob and Williams28,Reference Halpern and Nazroo29,Reference Neeleman and Wessely50,Reference Neeleman, Wilson-Jones and Wessely51 It is also possible that ethnic density alters the processes through which racism affects health. One study indicated that the effects of experienced racism may be weaker in areas of high ethnic density, Reference BeAcares, Nazroo and Stafford44 and suggested that ethnic density may promote resilience to racism by providing appropriate social support with which to resist the psychosocial stresses of racism.
In addition to ethnicity there is evidence that other aspects of a person's identity including socioeconomic position, Reference Yen and Kaplan56–Reference Albor, Pickett, Wilkinson and Ballas58 occupation Reference Wechsler and Pugh59 and religion, Reference Rosenberg60 may alter how people view and interact with the surrounding community, with health consequences. Even without the explicit experience of racism, having a marginalised or lower status identity may hinder the formation of a coherent sense of self, may lead to negative self-evaluation whereby an individual views themselves with lower esteem in their social interactions, and may create a conflict about where they fit in the world. Living in areas with people more like oneself may be more likely to reinforce one's own identity and allow an individual to view themselves with higher esteem, as it is widely acknowledged that identity and self-evaluation are both self-determined and shaped by the definitions of others, which may incorporate the perceived views of one's local community. Reference Jenkins61
Limitations
In interpreting the findings of the studies in this review, data and methodological factors might explain the variation in study results. However, for most study characteristics there were no clear trends and eliminating some elements of confounding using data was all but impossible. This provides further justification for our more narrative approach to synthesising findings. For example all but one study of psychoses and schizophrenia identified individuals with these conditions through contact with health services, so it is impossible to empirically distinguish whether the stronger association is due to true differences in prevalence or differences in care-seeking behaviour or diagnosis. Another example of a heterogenous methodological characteristic was the geographical scale of areas. It is not clear either theoretically or empirically whether or not ethnic density operates at small or large scales.
Finally, studies varied widely in the levels and distribution of ethnic density across areas. Some studies may not have had sufficient variation in ethnic density between areas to permit meaningful analysis, and if there exists an ethnic density threshold below which protective effects do not take place, some studies may not have had enough areas beyond such a threshold to identify such effects. Again, with such a high level of heterogeneity, it was not possible to conclusively attribute the variation in results to any particular methodological differences between studies, or to contextual differences, such as the national setting or minority ethnic group analysed.
Implications
In conclusion, although the results of this review are not entirely consistent with the idea that ethnic density is protective for all ethnic minority groups across all mental health outcomes, a semi-quantitative assessment of the evidence suggests that ethnic density is more often beneficial to the mental health of ethnic minorities than detrimental. What is more, there is some indication that one reason why protective associations are not consistently found is because of a lack of power in statistical analyses. Nevertheless, making conclusive remarks is not possible as multiple methodological factors that may have influenced results varied markedly across studies. Further research with improved methods, such as larger sample sizes and longitudinal designs, may allow for stronger conclusions. However, the fact that we ever detected a positive association between ethnic density and mental health, given the strong associations between minority status, area-level material deprivation and low socioeconomic position, and the fact that many studies did not adjust for area-level deprivation tells us something about the potential importance of psychosocial benefits that may be derived from living among people like oneself.
Appendix Characteristics on which analyses were classified
| Study identifiers |
| Author |
| Publication year |
| Data attributes |
| National origin |
| Year data collected |
| Age |
| Gender |
| Ethnicity |
| Size of area used to measure ethnic density |
| Study design |
| Ecological- or individual-level data |
| Operationalisation of ethnic density |
| Range of ethnic density |
| Whether ethnicity coded as continuous or categorical measure |
| Same ethnic density or overall minority density |
| Individual sample size |
| Area sample size |
| Response rate |
| Confounding factors adjusted for: |
| Age |
| Gender |
| Acculturation/language |
| Social support |
| Nativity/age at migration |
| Individual or household socioeconomic position |
| Martial status/family structure |
| Area socioeconomic position |
| Exposure to racism |
| Health outcome |
| Health outcome type |
| Measure used |
| Treated outcome or population sample |
| Direction of association and significance level |
| Investigation of non-linearity |
| Direction of effect with mediating factors removed |
Funding
This study was supported by grants to K.E.P. from the Medical Research Council and to M.S. from the Economic and Social Research Council. K.E.P. and M.S are also supported by UK NIHR (National Institute of Health Research) Personal Awards. L.B. is supported by an ESRC/MRC Interdisciplinary Postdoctoral Fellowship.


eLetters
No eLetters have been published for this article.