1 Introduction
The representativeness heuristic, RH, (Kahneman & Tversky, Reference Kahneman and Tversky1972) has been used to explain numerous findings in the judgment and decision making literature, particularly in the context of risk and uncertainty. It delivers clear predictions in gambling when both the functional form and the parameters of the underlying random process are known. Specifically, RH-related gambler’s fallacy may lead to the belief that a win is “due” after a streak of losses (Sundali & Croson, Reference Sundali and Croson2006). Equally telling of RH is that lottery players who can choose their own numbers typically avoid recently drawn combinations (Clotfelter & Cook, Reference Clotfelter and Cook1993; Suetens et al., Reference Suetens, Galbo-Jørgensen and Tyran2016; Wang et al., Reference Wang, van Loon, van den Assem and van Dolder2016), even though they are equally likely to come out in the following draws. Moreover, other types of preferences for particular combinations of numbers are often reported in Lotto gambles; namely, many players tend to spread their choice of numbers as evenly as possible (Lien & Yuan, Reference Lien and Yuan2015; Wang et al., Reference Wang, van Loon, van den Assem and van Dolder2016), and favor “random-looking” combinations, such as [12, 23, 24, 27, 31, 39] over distinctive ones, such as [1, 2, 3, 4, 5, 6] (Holtgraves & Skeel, Reference Holtgraves and Skeel1992; Ladouceur et al., Reference Ladouceur, Dube, Giroux and Legendre1995; Henze & Riedwyl, Reference Henze and Riedwyl1998; Hardoon et al., Reference Hardoon, Baboushkin, Derevensky and Gupta2001; Chóliz, Reference Chóliz2010), even though the probability of winning is the same. Clearly, [1, 2, 3, 4, 5, 6] is not representative of a uniform distribution over 1–49. For this reason, it may be perceived as less likely to come up in a draw.
In this study, we looked at two distinct predictions of the RH in the context of gambling and the link between them. First, we observed how many people do indeed prefer “random” combinations on their lottery tickets over distinctive combinations. Second, we investigated perceptions of the most likely outcome of a coin toss, depending on whether the previous three outcomes were all tails or all heads. Additionally, we looked at the link between these two choices, particularly whether individuals with a preference for “random-looking” combinations tend to expect a reversal (a tail after three heads or vice versa). The latter question, a novelty in this literature, is of interest because one may expect that people applying the RH in one task will be more likely to also use it in the other one.
Our main task was incentivized, involving a choice between real lottery tickets (from a state-wide lottery game) which, if drawn, could result in an exceptional win for the subject. This is in contrast to most previous studies on lottery ticket preferences (e.g., Holtgraves & Skeel, Reference Holtgraves and Skeel1992; Ladouceur et al., Reference Ladouceur, Dube, Giroux and Legendre1995; Hardoon et al., Reference Hardoon, Baboushkin, Derevensky and Gupta2001; Rogers & Webley, Reference Rogers and Webley2001 and Chóliz, Reference Chóliz2010), which involved merely hypothetical choices. Most of these used small student samples, whereas our subjects were a large and heterogeneous sample of passers-by in the streets of Warsaw, Poland.
The subjects were given two tasks. First, we asked them to choose between two tickets from the popular Multi Multi lottery game. The numbers on one of them were randomly generated, while those on the other formed a pattern (e.g., [35,40,45,50,55,60,65,70,75,80]). Since the RH involves expecting a randomly drawn sample to resemble the general population in its main characteristics (Tversky & Kahneman, Reference Tversky and Kahneman1971), we expect a clear preference for the “Random” tickets over the “Distinctive” ones.
The subjects were then invited to reconsider their choice after a small cash bonus was added to the rejected ticket. A similar procedure had previously been used to study subjects’ (un)willingness to exchange lottery tickets by Bar-Hillel and Neter (Reference Bar-Hillel and Neter1996). Although reluctance to take the bonus and switch to the other ticket may reflect a number of specific mechanisms, including regret aversion and status-quo bias,Footnote 1 it generally suggests a stronger liking of the ticket chosen initially; in the case of indifference, the subject should gladly switch, thereby allowing them to cash in the bonus.
In the second, hypothetical, task, respondents were asked which outcome of a coin toss was more likely after a sequence of three heads (or three tails). RH proposes that even in a small sample, about half the tosses should bring heads, so that, say, after a sequence of three heads, a tail is more representative (reversal). We asked whether people who prefer “random” combinations of numbers on their ticket tend to be the same people who think a head is more likely after three tails (or a tail after three heads).
2 Method
The experiment was run during several days between August and October 2017. The 472 subjects were random passers-by approached in several locations in the city of Warsaw, including two metro stations, the central train station, a shopping center, a farmer’s market, outside an office building, a sports center, a central roundabout and a crossing of two streets near one of the lottery offices.
Roughly 53% of subjects were female. Subjects’ age varied between 9 and 86 years, with a mean of 36.5 and a standard deviation of 16 years.Footnote 2
The main task involved a choice between two lottery tickets. For this purpose, a popular Multi Multi game from Totalizator Sportowy (a state-owned monopolist in the field of numbers games and lotteries in Poland) was selected. The game involves guessing up to 10 numbers between 1–80. In each game, 20 numbers are randomly drawn (twice daily), and the amount of matching numbers determines players’ payoff. The cost of a single ticket used in the experiment was 2.5 PLN (ca. 0.67 USD). The prizes in Multi Multi (see Table 1) are guaranteed, generally meaning that every combination of, for example, 10 numbers is as good as any other,Footnote 3 and yields about 1 PLN in expectation.
Table 1: Distribution of prizes in Multi Multi

Every choice involved one “Random” and one “Distinctive” ticket, each with 10 numbers in an ascending order. On Random tickets, the 10 numbers were generated using the “quick pick” random generator provided by the lottery operator. None of them were rejected ad hoc, as all appeared to be more random than the Distinctive ones. If the subjects thought differently, they had the opportunity to express this when they were asked to justify their choice.Footnote 4 These Random tickets were paired with the Distinctive ones at random.
For Distinctive tickets, one of six very specific combinations was always used; see Table 2. The labels “low”, “medium” and “high” mean that the sequence involved low, medium or high numbers (on average); these labels were not given to the subjects. We chose three sequences with consecutive numbers and three with numbers ending in 0 or 5, as these can be easily identified as specific when printed out in a row (as they are on Multi Multi tickets).Footnote 5
Table 2: Types of “Distinctive” combinations used

The subjects were greeted and told that the researcher was a representative of the University of Warsaw conducting a brief study; furthermore, subjects were told that in return for participating they would receive a pre-paid lottery ticket (see Appendix A for the wording of a typical interaction). The lottery ticket being an incentive might have caused a selection bias towards those who regularly play games of chance. However, from our sample we see that 51% of the subjects declared that they play lotteries at least once a year, which is similar to the general population.Footnote 6 This is consistent with our observation that the majority of the passers-by who refused to participate did so before even hearing what the study was about.
Those who agreed to participate were presented with two Multi Multi tickets – the Distinctive and the Random – for the soonest draw (taking place later that day) and asked which one they liked more; subjects knew that they would receive their preferred ticket for free. About 13% said they were indifferent and were urged to choose one nevertheless. Once subjects had stated their preference, they were asked the same question again, but this time the experimenter offered either .5 PLN or 1 PLN in cash as a bonus associated with the unwanted ticket (explaining that this was the last choice to be made). Note that .5 PLN (1 PLN) is equivalent to 20% (40%) of the standard price of the ticket or ca. 50% (100%) of the expected value of the prize. We registered whether subjects stayed with their initial choices or switched. They were then asked to justify their choices.
Subsequently, they were asked to answer a simple question:
“If we toss this coin (or any other) three times, and three times in a row we get heads, then what is more likely to come up the fourth time?”
This task was not incentivized. Finally, the subjects reported whether they ever gambled, and their age, and then were free to go; the experimenter noted the location and approximate time of the subject’s participation, and the subject’s gender.
The experiment used a 6x2 (six types of Distinctive sequences; 0.5 PLN vs. 1 PLN offered as a bonus for the unwanted ticket) fully randomized between-subject design.Footnote 7
3 Results
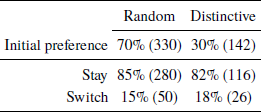
Table 3 shows the proportion (and number) of people choosing Random vs. Distinctive. Overall, there is a very clear preference for the former (70%, z = 8.65, p < .001). For either option, the majority of subjects stayed with their initial choice, even if a cash bonus was added to the rejected ticket.Footnote 8 Unsurprisingly, there was a somewhat stronger tendency to switch for the higher bonus (20% vs. 13%, z = −2.05, p = .04); even so, no link between initial preference and switching with the bonus (z = 0.86, p = .4) could be found.
Table 3: Subjects’ choices in the lottery ticket task
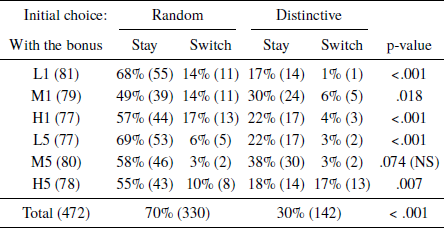
Subjects’ preferences for each of the six Distinctive patterns can be seen in Table 4. Initial choices relatively often favored the Distinctive ticket when it involved medium numbers (M1 and M5, z = 2.8, p = .01; M5 was the only condition in which the initial choices of Random and Distinctive were not significantly different, see the rightmost column of Table 4). Conditional on having initially chosen the Random ticket, our subjects were more willing to switch when the distance between the numbers on the Distinctive ticket was 5 rather than 1 (z = 2.7, p = .01). Overall, these patterns are consistent with the notion that less representative combinations of the parent population, such as L1, were least appealing, whereas the arguably more representative M5 was slightly more attractive.
Table 4: Percent (and number) of preferences for each of the 6 distinctive patterns. P-values are for two-sided proportion tests of the hypothesis that random and distinctive are equally common
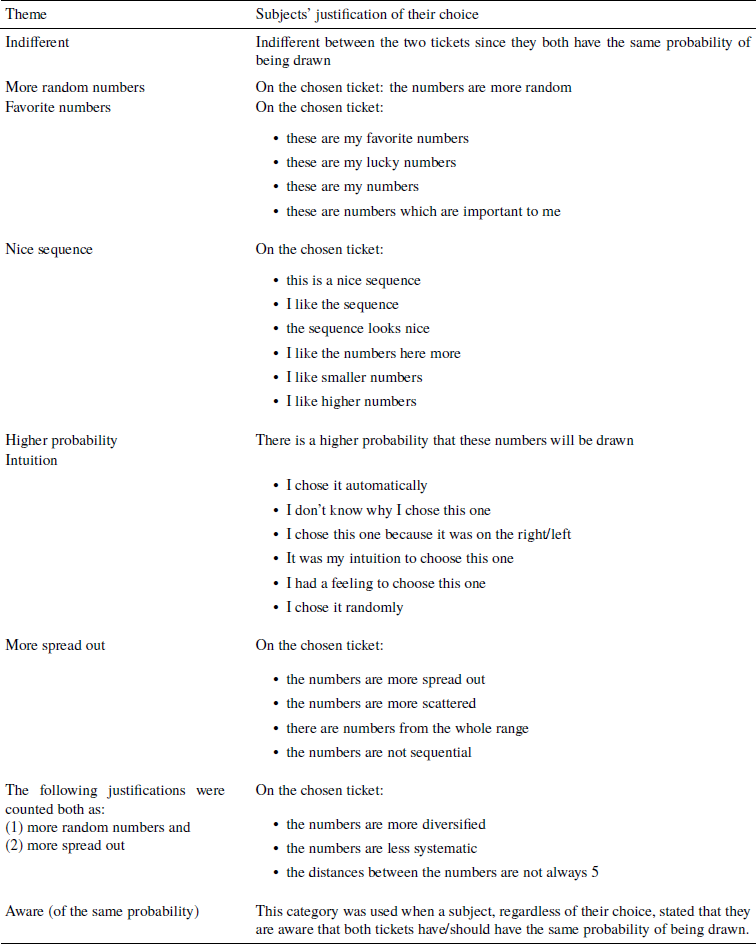
After this first task, the subjects were asked to justify their initial choice of ticket. Although the justifications were not always completely coherent, some common themes, which are not mutually exclusive, could be identified (see Appendix B for the typical justifications, and Table 5 for their prevalence).
Table 5: Percent (and number) of justifications of ticket choice in the lottery ticket task
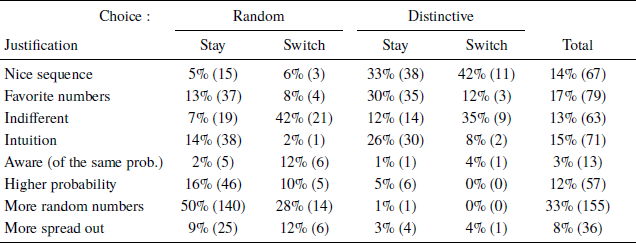
Note: Several subjects gave more than one justification, while some gave none. In total, the 472 subjects provided 541 justifications, meaning that the numbers in the columns may add up to more than 100%.
Among those who preferred the Distinctive ticket, justifications categorized as referring to a “nice sequence” were most commonly used (35%). Another 27% said that some of their favorite numbers (often associated with dates) were involved, which is a finding consistent with that of Wang et al. (Reference Wang, van Loon, van den Assem and van Dolder2016). Those with a strong preference (choosing to remain with their initial ticket and forego the bonus (Stayers)) were relatively likely to say that they picked intuitively, without an in-depth thought process (as did 26% of Distinctive Stayers, in contrast to 8% of Switchers).
Subjects with a strong preference for Random (choosing Random and Stay) often said that these numbers were indeed “More random” (50%). The second most popular, albeit considerably less common (16%), answer in this category was an explicit statement that Random yielded a higher probability of winning.
Subjects with a weak preference (the two Switch columns) relatively often mentioned that they were in fact indifferent. Forty-two percent of those who decided to switch after initially choosing Random and 35% after choosing Distinctive said they were indifferent between the tickets, while only 7% of the Stayers, who were initially Random, and 12% who were initially Distinctive, decided to switch with the bonus.
We now move on to subjects’ behavior in the coin task. Overall, 34% (158 subjects) predicted a reversal (heads after three tails, or vice versa). Predictions of continuation (e.g., tails after three tails) were given by 19% (89) of the subjects. The rest, 47% (215), gave the normatively correct answer of 50/50.Footnote 9 These findings are broadly consistent with previous research showing that both positive recency and negative recency are observed in forecasting tasks, with the latter dominating when the random mechanism is unambiguously presented as a series of independent random draws (Oskarsson et al., Reference Oskarsson, Van Boven, McClelland and Hastie2009).
Looking across the tasks, we failed to observe a significant link between subjects’ initial preference (Random vs. Distinctive) in the lottery ticket task and their behavior in the coin task; see Table 6 (p = .921 for the chi-square test of dependence between a dummy variable indicating Reversal and initial choice in the lottery ticket task; p = .104 for the three-way split in the coin task and initial choice in the lottery ticket task). The use of RH in one task does not therefore predict its use in the second task, contrary to what we expected. Notably, self-reported gambling habits are not correlated with the observed choices for either the lottery ticket or the coin task.
Table 6: Behavior across the tasks: Initial ticket preference and the coin task
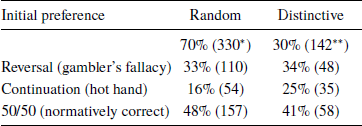
* 9 invalid so the column below adds up to 321.
** 1 invalid so the column below adds up to 141.
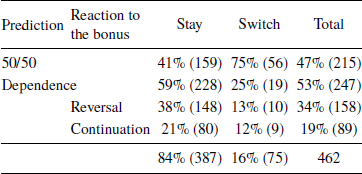
However, it is clear that those 75 subjects willing to switch to another ticket when offered the bonus in the lottery task made different predictions in the coin tasks than the remaining 387 subjects (who were unwilling to switch); see Table 7. The prevalence of predicting 50/50 was significantly higher among the “switchers” than among the “stayers” (in a two-sided test of proportions, z = −5.38, p < .001), while the “stayers” were three times more likely than the “switchers” to predict a reversal (z = 4.1, p < .001). The difference in the less common prediction of continuation was not significant (z = 1.7, p = .09). These effects were robust when controlling for other variables. Also, the “switchers” were almost twice as likely to predict reversal (38%) than continuation (21%), whereas there was no such difference for the “stayers”. This result indicates that subjects who made the normatively incorrect decision with respect to the bonus were more susceptible to the gambler’s fallacy.
Table 7: Relationship between reaction to the bonus and choice in the coin task
4 Summary
In the current study, we asked whether people preferred “random-looking” lottery combinations over distinctive ones. We confirmed a preference for “random” combinations, even in the face of an additional payoff, which is consistent with the previous literature and the notion of representativeness heuristic. In line with Lien and Yuan (Reference Lien and Yuan2015) and Wang et al. (Reference Wang, van Loon, van den Assem and van Dolder2016), we found that subjects preferred sequences with numbers spread out more evenly. The study’s qualitative results, gathered after asking subjects to explain their choices, show that even though people seem to follow RH, few are willing to admit they believe their chances of winning are higher. The most common justification among the Random choosers was an appealing (albeit rather vague) answer that the numbers were “more random”. Among those who preferred the distinctive sequence, answers pertaining to its “nice looking” appearance were the most frequent. In both groups, even though 13% of the subjects stated their indifference to the two tickets, only half of them switched to the other one when offered a bonus.
In our coin prediction task, we found that less than half of our subjects gave the normatively correct 50/50 response. In the remaining subjects, reversal of a streak was twice as common as its continuation, and the two seemed to have similar determinants. The prevalence of gambler’s fallacy is consistent with the results of Clotfelter and Cook (Reference Clotfelter and Cook1993) and Suetens et al. (Reference Suetens, Galbo-Jørgensen and Tyran2016). There was no apparent link between subjects’ initial preference (Random vs. Distinctive) in the lottery ticket task and their choice in the coin task. In other words, RH did quite well in predicting behavior in each task separately. However, no group of subjects consistently following RH across the two tasks could be identified. Interestingly, we also found that those unwilling to switch with the bonus were twice as likely to predict streak reversal as streak continuation, in line with the gambler’s fallacy.
Nevertheless, we did find a correlation between switching the ticket with the bonus in the lottery ticket task and predicting 50/50 in the coin task, which means that there is a general tendency to either be rational or irrational in both. As discussed by Toplak et al. (Reference Toplak, West and Stanovich2011), cognitive reflection may be an explanation of the use of heuristics in various contexts. In our case, it could be responsible for the rationality/irrationality in both tasks.
Appendix A: The protocol
Verbal version:
[INTRO] Hello, I’m from the University of Warsaw, I’m conducting a scientific study, can I take 3 minutes of your time? In return, I have a pre-paid lottery ticket for you for a Multi Multi game from LOTTO.
[If YES, then:]
[MAIN] So, in the Multi Multi game, out of numbers from 1 to 80, 20 numbers are being drawn, and you can bet on up to 10 numbers – and so is in the present case. The prize depends only on how many numbers from the chosen ticket will be drawn and matched (the fewer the numbers the smaller the prize), whereas if all 10 numbers are drawn, there is a guaranteed prize of 250.000 PLN, regardless of the numbers that other players chose.
I have two tickets here — they differ only in the betted numbers. Please have look at them and choose one of these two tickets, with the numbers you prefer.
-
1) [Subjects select one according to their own criteria and indicate which one.]
-
2) And what if I add 50gr/1zł to the other one [the one they didn’t select], which ticket will you then choose?
[YES - they choose the other one and the cash bonus]:
-
• Why did you initially choose this one?
-
• Why did you change your mind?
[NO - they stay with their first choice]
-
• Why did you choose this one?
I have just three more short questions:
-
1. If we toss this coin (or any other) three times, and three times in a row we get heads/tails, then what is more likely to come up the fourth time?
-
2. Do you sometimes play the lottery, Lotto or other games of chance?
And the last question:
-
3. How old are you?
That’s all, thank you. Have a nice day.
Appendix B: Common themes from the subjects’ justifications of their ticket choice
