1. Introduction
Agriculture is the primary source of livelihood in most developing countries. Enhancing agricultural production and productivity serves the vital policy objective of augmenting farmers’ income and alleviating poverty (Koirala et al., Reference Koirala, Mishra and Mohanty2016; Christiaensen et al., Reference Christiaensen, Demery and Kuhl2011). Large-scale investment for infrastructural developments in this sector comes primarily from government initiatives (public sector investment) in irrigation, dams, power, storage, transport, marketing, research, and development activities. However, farmers and cooperatives (private sector) put their efforts and resources into creating farm assets and land conservation through land reclamation, bunding, wells, orchards and plantations, irrigation resources, agricultural implements, and farm machinery (Akber, Paltasingh, and Mishra, Reference Akber, Paltasingh and Mishra2022; Kumar et al., Reference Kumar, Bathla and Verma2020). The resources put for all these asset creations and conservation form private investments at the farm level by the farmers, and they are complemented and supplemented by public investment in farmland (Akber and Paltasingh, Reference Akber and Paltasingh2019, Reference Akber and Paltasingh2024; Gulati and Bathla, Reference Gulati and Bathla2001).
Public and private investments are required for India’s agricultural sector’s productivity, sustainability, and growth (Akber and Paltasingh, Reference Akber and Paltasingh2021, Reference Akber and Paltasingh2024; Bathla and Kumari, Reference Bathla and Kumari2017). However, when public investment has been secularly declining since the 1980s, the private investment at the farmers’ level is not up to the expected level (Gulati and Bathla, Reference Gulati and Bathla2001; Chand & Kumar, Reference Chand and Kumar2004; Akber et al., Reference Akber, Paltasingh and Mishra2022), rendering growth stagnation in Indian agriculture (Nadkarni Reference Nadkarni2018; Sainath, Reference Sainath2018; Akber and Paltasingh, Reference Akber and Paltasingh2021). So, the revival of that increasing trend in both types of investment holds the key to reversing the gloomy picture in Indian agriculture. However, maintaining the right tradeoff between two types of public expenditure, i.e., public investment and farm input subsidies to boost on-farm private investment, is a matter of public policy (Akber et al., Reference Akber, Paltasingh and Mishra2022). Knowing what stimulates farmers to put adequate efforts and investments into farmland at their level, except public farm investment, could be critical from a public policy perspective. Moreover, understanding the factors explaining the farm-level investment and its variability may provide the necessary inputs for better policymaking and implementation of designed policies.
The literature argues that among many factors (such as credit accessibility, farm size, farm experience, and farmers’ education), land ownership/tenure security is a vital institutional factor affecting farmers’ decisions to investin farmland. Economic theory predicts that a lack of tenure security regarding land ownership or legal rights supporting users’ claims or tenancy rights may restrict and/or discourage tenants from investing optimally in farmland (Banerjee and Ghatak, Reference Banerjee and Ghatak2004; Koirala et al., Reference Koirala, Mishra and Mohanty2016; Paltasingh, Reference Paltasingh2018). It is because the tenants share a portion of their produce with the landlord and live under constant threat of being evicted from cultivating the land (Ali et al., Reference Ali, Abdulai and Goetz2012; Banerjee and Ghatak, Reference Banerjee and Ghatak2004; Koirala et al., Reference Koirala, Mishra and Mohanty2016; Paltasingh et al., Reference Paltasingh, Basantaray and Jena2022).Footnote 1
Lack of investment in farmland leads to a decline in farm productivity and efficiency – popularly known as the “Marshallian inefficiency hypothesis,” termed by Alfred Marshall in the early 1920s. The hypothesis has attracted much attention among researchers, and we have a vast empirical literature examining this hypothesis. However, researchers have no consensus on the empirical validation of the above hypothesis (Besley and Ghatak, Reference Besley and Ghatak2010). Nevertheless, findings from some studies supported the arguments (Feder and Onchan, Reference Feder and Onchan1987; Shaban, Reference Shaban1987; Place and Hazell,Reference Place and Hazell1993; Basley, Reference Besley1995; Banerjee and Ghatak, Reference Banerjee and Ghatak2004; Li et al., Reference Li, Rozelle and Brandt1998; Shively, Reference Shively1997; Jacoby and Mansuri, Reference Jacoby and Mansuri2009; Abdulai et al., Reference Abdulai, Owusu and Goetz2011; Ali et al., Reference Ali, Abdulai and Goetz2012; Bambio and Agha, Reference Bambio and Agha2018; Paltasingh, Reference Paltasingh2018; Paltasingh et al., Reference Paltasingh, Basantaray and Jena2022). These studies investigate the impact of land ownership security on farm-level investment, productivity, efficiency, and technology adoption. However, some other studies (Gavian and Ehui, Reference Gavian and Ehui1999; Kassie and Holden, Reference Kassie and Holden2007; Pender and Fafchamps, Reference Pender and Fafchamps2006) contradict the Marshallian inefficiency hypothesis. Further, Migot-Adholla et al. (Reference Migot-Adholla, Benneh, Place, Atsu and Bruce1994) and Pinckney and Kimuyu Reference Pinckney and Kimuyu(1994) found land rights had a low impact on investments in soil improvement and the planting of tree crops. Lastly, Place and Hazell (Reference Place and Hazell1993) reveal, with few exceptions, that land rights were not significant determinants for investing in land.
In Indian agriculture, many micro-level studies have examined this hypothesis, but the debate remains inconclusive.Footnote 2 This study aims at investigating the same hypothesis using nationally representative survey data on India’s agriculture sector. It also contributes to the literature by examining the role of land ownership in the variability of farm investment from its mean investment level, which is grossly ignored in Indian agriculture and across the globe. Hence, the main objective of this study is to examine the impact of land ownership and other socioeconomic factors on farm-level investment and variability in investment. The study used cross-sectional data compiled from the Situation Assessment Survey of Agricultural Households 2019–2021 of the 77th round of the National Sample Survey Office (NSSO).
The core analysis revealed that land ownership status induces a higher level of farm investment and reduces the variability of investment. Among other determinants, farm size, farmer’s education, age, access to irrigation, credit, technical assistance, awareness about the minimum support price (MSP), nonfarm income, etc., significantly induce on-farm investment. But, along with landownership status, farm size, farming experience, education, access to technical assistance, irrigation, knowledge about MSP, etc., reduce investment variability. In contrast, credit access, nonfarm income, and household size augment investment variability.
This study contributes to the literature in several ways. First, it is the first study in the case of Indian agriculture covering a large sample, looking into the determinants of investment and investment risk (variability). So, it is unique as it gives insights not only into factors affecting mean investment level but also its variability. Second, the core results are obtained after controlling for major econometric problems like endogeneity and heterogeneity, which are relevant for effective policymaking by planners and policymakers for farm-level capital accumulation. This is vital for alleviating growth stagnation in Indian agriculture.
2. Reforms in land tenure system in India: a historical anecdote
Land reforms in India’s rural economy have a long history, even before the country’s independence. However, on the eve of India’s independence in 1947, land reforms, especially the redistribution of land from the haves to the have-nots, became a top priority on the policy agenda (Ghatak and Roy, Reference Ghatak and Roy2007). Since independence, a significant body of land reforms has been enacted into law. The Constitution of India in 1949 granted the states the power to adopt and implement land reforms. This resulted in the execution of the reforms varying significantly across the states and over time. Land reform acts have been classified into four categories (Mearns, Reference Mearns1999; Basley and Burges, Reference Besley and Burgess2000). The first category is tenancy reform for regulating and stipulating the contract terms, namely shares in share tenancy contracts and attempts to abolish tenancy and transfer ownership to tenants. The second category abolished the intermediaries that prevailed before independence. The main goal of these acts was to curtail the powers of exploitative landlords. The third category imposed ceilings on the amount of land a person could own. The fourth category of land reform redistributed surplus land from the haves to the have-nots and consolidated landholdings. This reform act ensured that small landowners who owned small portions of land at different places could consolidate them into a single holding to boost productivity in the sector. These land reform measures undoubtedly eliminated some feudalistic characteristics in agrarian relations. Still, the country’s agricultural structure has not become more rational and equitableFootnote 3 (Chattopadhyay, Reference Chattopadhyay1973).
Every Indian state passed land reform laws during the 1960s and 1970s to ensure greater tenure security. However, with some exceptions, like in Kerala and West Bengal, the results were not satisfactory (Ghatak and Roy, Reference Ghatak and Roy2007). Due to weaknesses in the law and loopholes, the gap between the laws’ objectives and implementation was significant (Hanstad et al., Reference Hanstad, Haque and Nielsen2008). For example, under the landholding ceiling law, 1.7% of the land was considered surplus, but only 1% was redistributed (Appu, Reference Appu1996). The West Bengal Land Reforms Act of 1971 imposed the limit of 5 hectares of irrigated land as the ceiling for a family of five. In the case of unirrigated land, the ceiling was 7 hectares per family. Under this act, landowners were required to produce detailed records of their possessions, family size, and the surplus land they were supposed to surrender to the government. However, problems in implementing and executing this act soon became apparent (Bardhan and Mookherjee, Reference Bardhan and Mookherjee2010). Similarly, the institution of tenancy was abolished during the 1970s, and the states of Assam, Gujarat, Kerala, Tamil Nadu, and West Bengal implemented the policy effectively to give tenants more bargaining power. However, the self-interest of landlords forced the state governments to delay the legislation (Thimmaiah and Aziz, Reference Thimmaiah, Aziz, Thimmaiah and Aziz1984).
Nonetheless, this policy helped the tenants and the actual cultivators to some extent in some places. Fearing the loss of their land, owners engaged in nonagricultural activities, leaving large areas uncultivated (Thimmaiah, Reference Thimmaiah2001). Similarly, the policy of putting ceilings on land holdings was not uniform in all the states. In states like Andhra Pradesh, Bihar, Gujarat, Haryana, Jammu & Kashmir, Himachal Pradesh, Karnataka, Kerala, Rajasthan, and Tamil Nadu, the policy applies to both the owner and the tenant. However, only owners were subject to it in Assam, Maharashtra, Odisha, Punjab, Uttar Pradesh, and West Bengal. Ceiling limits also varied across the states.
The defects and loopholes in overall land reforms resulted in the land reform legislation harming India’s agricultural productivity (Ghatak and Roy, Reference Ghatak and Roy2007). But as Srinivasan (Reference Srinivasan2007) pointed out, due tenancy reform – Operation Barga of West Bengal – was instrumental in protecting tenants’ legitimate and legal rights and modestly augmented tenants’ productivity. Furthermore, Besley and Burgess (Reference Besley and Burgess2000) showed that adopting land reforms (especially for tenancy protection legislation) in Indian states between 1958 and 1992 led to considerable decreases in rural poverty rates.
Looking at the landholding distribution with respect to ownership status, the latest round of NSSO data shows that 13% of total cultivable land is under tenancy while 85.6% is under ownership holdings. The trend of landownership from various rounds of NSSO data shows a declining share of ownership in operational landholding in India over the past two decades. Figure 1 shows that the percentage share of owned land in total operational holdings declined to 85.6% in 2018–19 from 92.7% during 2002–03. However, the share of leased-in land registered a two-fold increase (6–13%) during the given periods. So, this increasing trend of tenancy underscores the importance of studying its influence on farm-level investment and its variability, along with other farm and farmer-specific characteristics.
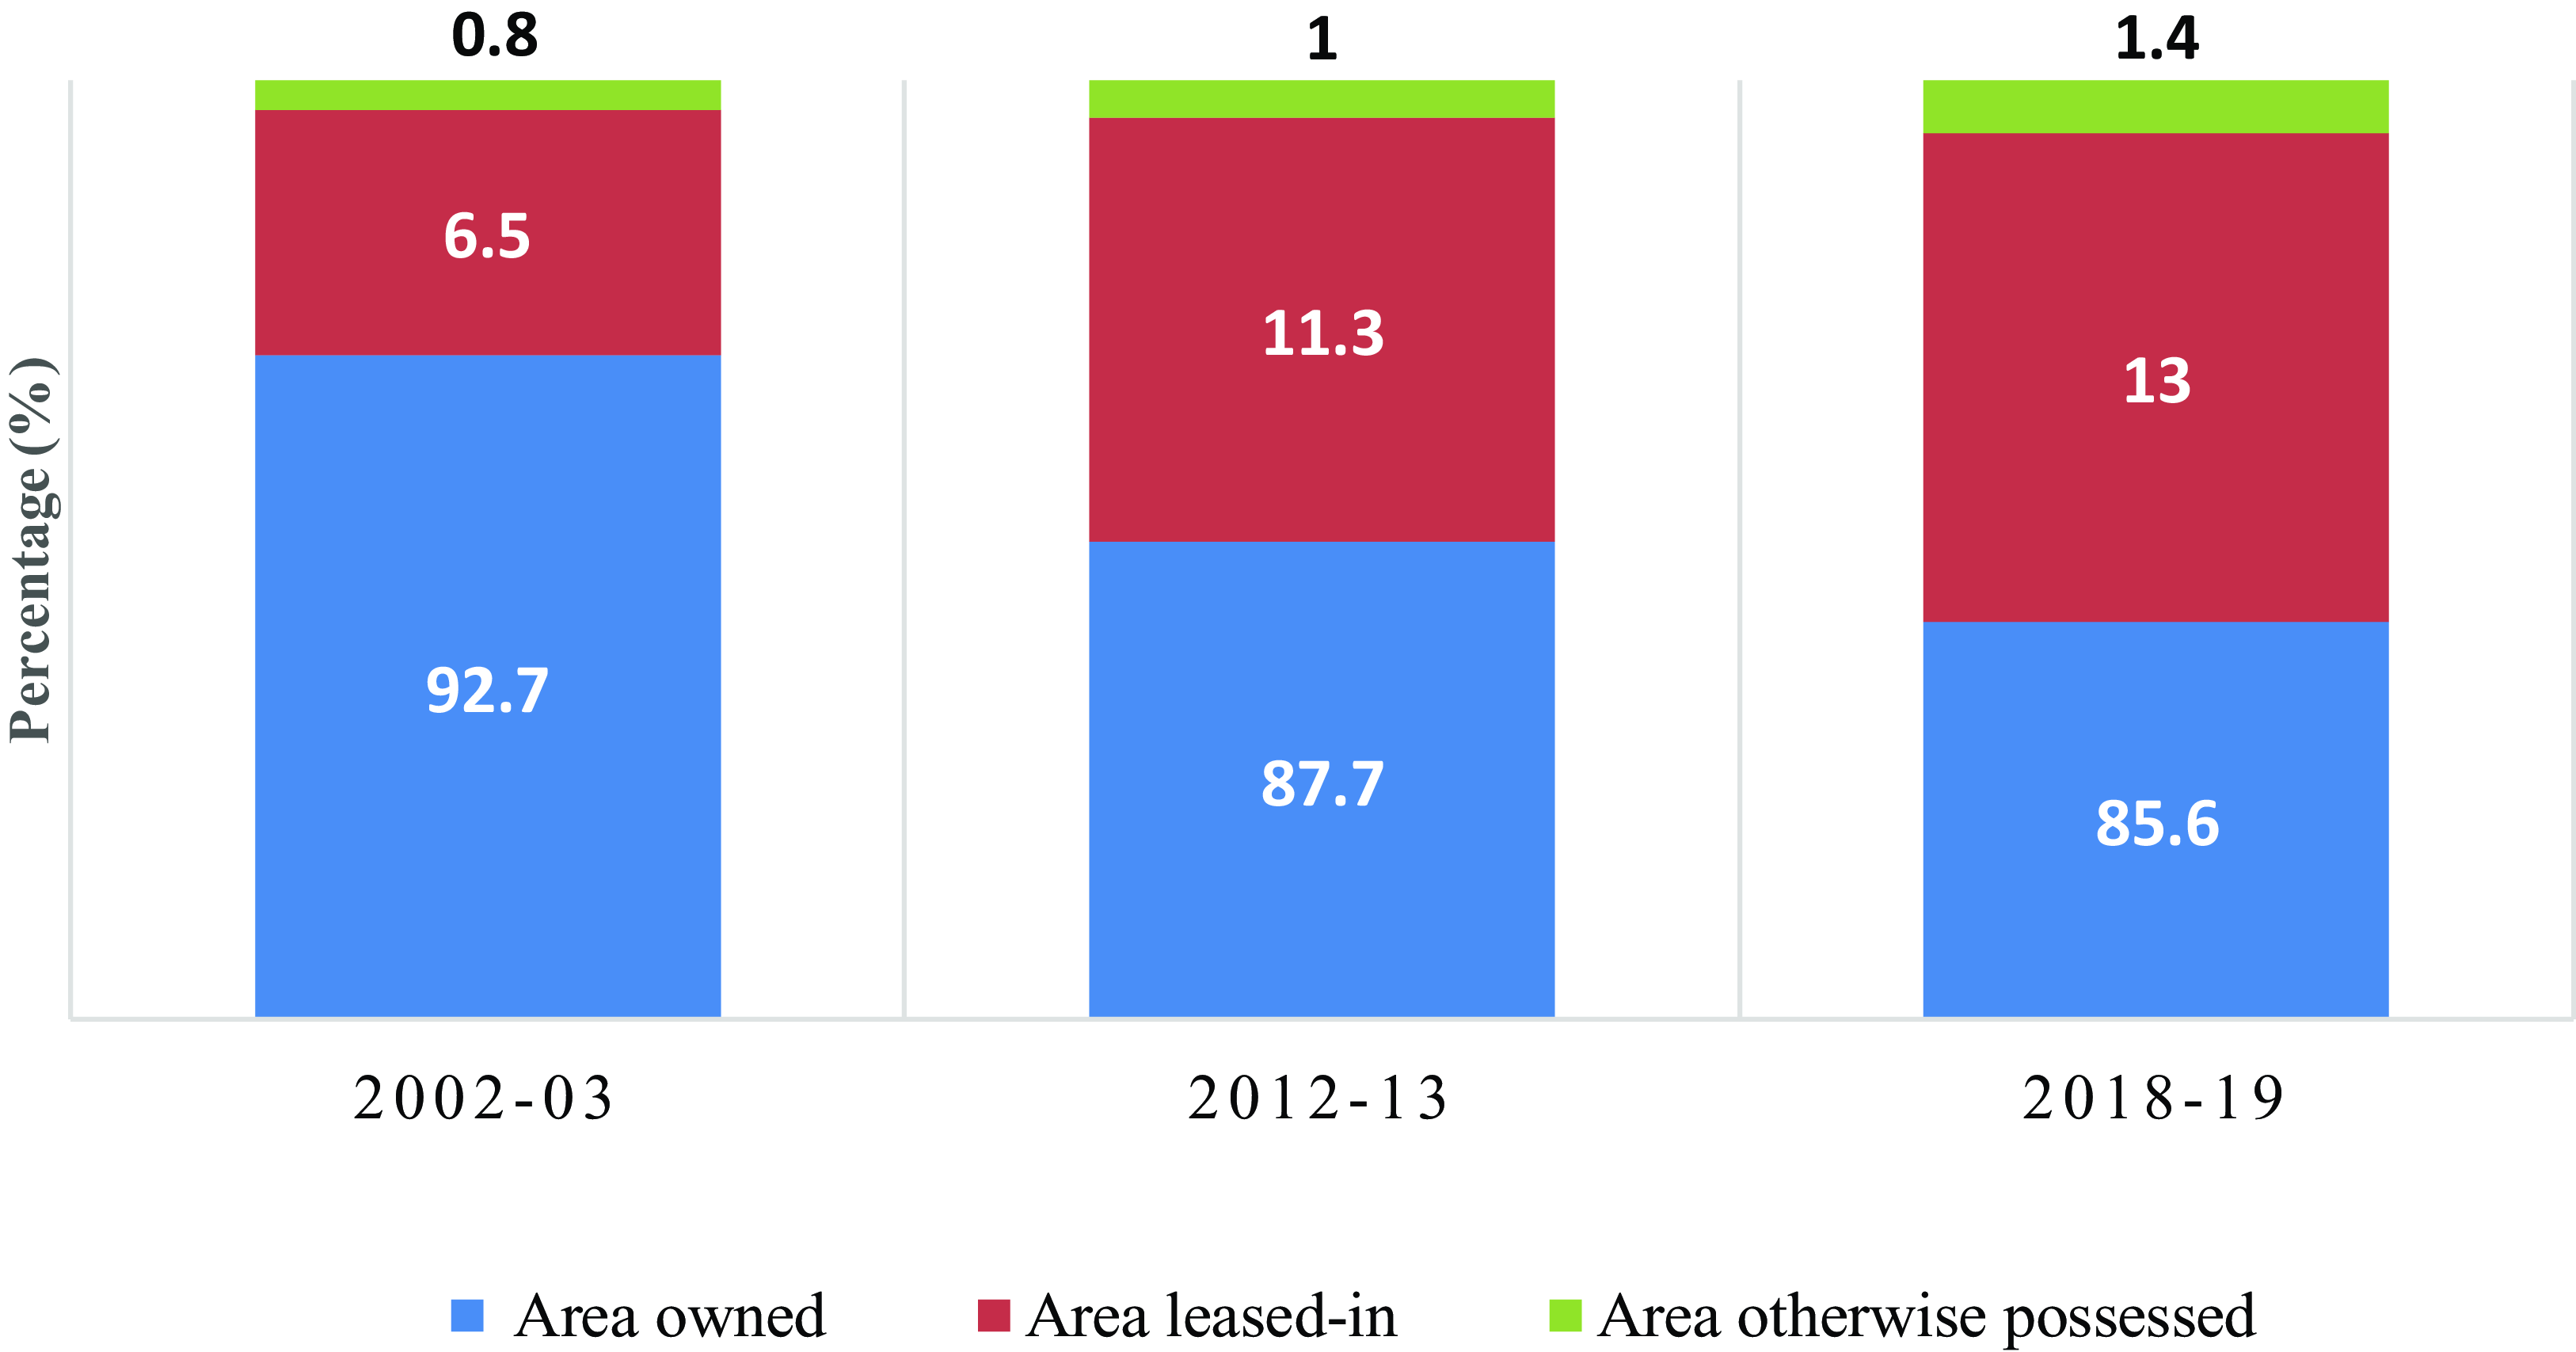
Figure 1. Trends in operational landholding distribution in Indian agriculture. Source: NSSO’s Situation Assessment Survey of Agricultural Households – 2003–04, 2013–14 and 2019–20.
3. Theoretical framework
For examining the impact of land tenure security on farm-level investment and its variability, we develop a simple theoretical model based on the flexible moment approach within the expected profit maximization framework of Antle (Reference Antle1983, 87). The intention is to introduce a simple model necessary for useful data analysis. In the model, the farmer’s investment function typically is assumed to be a function of plot/farm size (x), the farmer’s specific characteristics (z), and the tenure security (s) as:
where “I” represents the farm-level investment, x is plot or farm size, s is tenure security/landownership status, and z is the vector of farm and farmers’ specific characteristics like soil quality, land position, irrigation accessibility, farming experience, education, farm income, household size, credit access, etc. In this setting, the source of investment risk (variability in investment) is assumed to be determined mainly by land ownership status, which is implicitly defined as the proportion of owned land to the total operational landholding. In that case, it implicitly paves the way for the farmer’s adequate/optimal investment efforts. Following Paltasingh (Reference Paltasingh2018) and Paltasingh et al. (Reference Paltasingh, Basantaray and Jena2022), we accommodate all the farmers while defining this landownership status (s i ) for the i th farmer as:
where
![]() $\gamma _{i}={l_{i} \over O_{i}}$
measures the proportion of leased-in land (l
i
) in aggregate operational landholding (O
i
) of that ith farmer, indicating tenancy intensity. Thus, the value of s
i
varies within the range of 0 and 1. A value of 1 indicates that the concerned farmer is a pure owner-operator whose ownership status is highly secured. These farmers have complete ownership status in their operational holdings. A value of 0 indicates the reverse, as the entire operational landholding consists of leased-in land. The distribution of sis expressed as s ∼ χ(s|γ) and is assumed to be a major determinant of farm-level investment and investment variability. Following Antle (Reference Antle1983, Reference Antle1987) and Zhang and Antle (Reference Zhang and Antle2016), the variability in farm-level investment is captured by introducing the variance of investment through the moment-based approach as follows:
$\gamma _{i}={l_{i} \over O_{i}}$
measures the proportion of leased-in land (l
i
) in aggregate operational landholding (O
i
) of that ith farmer, indicating tenancy intensity. Thus, the value of s
i
varies within the range of 0 and 1. A value of 1 indicates that the concerned farmer is a pure owner-operator whose ownership status is highly secured. These farmers have complete ownership status in their operational holdings. A value of 0 indicates the reverse, as the entire operational landholding consists of leased-in land. The distribution of sis expressed as s ∼ χ(s|γ) and is assumed to be a major determinant of farm-level investment and investment variability. Following Antle (Reference Antle1983, Reference Antle1987) and Zhang and Antle (Reference Zhang and Antle2016), the variability in farm-level investment is captured by introducing the variance of investment through the moment-based approach as follows:
where f 1(.) = E(f(x, s, z)) represents the mean of the investment function. Given equation (3), the first moment of the investment function can be defined as:
Similarly, the second moment (variance) of the investment function is defined as:
Following Zhang and Antle’s (Reference Zhang and Antle2016) specifications, in equations (4) to (5), we can express E [U(π)] as a function of the first two moments of the distribution of net returns from investment:
where π is the net returns from investment and E is the expectation operator. We assume farmers are risk-averse and maximize the expected utility of net returns from investment by choosing I and x in the following manner:
Having defined
![]() $U^{j}={\partial ^{j}U\left(\mu _{1},\mu _{2}\right) \over \partial \pi _{j}}; j\in \mathbb{N}$
, and using a second-order Taylor’s approximation of the expected utility function yields the optimality condition as:
$U^{j}={\partial ^{j}U\left(\mu _{1},\mu _{2}\right) \over \partial \pi _{j}}; j\in \mathbb{N}$
, and using a second-order Taylor’s approximation of the expected utility function yields the optimality condition as:
This optimality condition in equation (8), in the form of elasticity, can be written as:
Where
![]() $\mu _{j}^{*}={\partial ln\mu _{j} \over \partial lnx}$
and
$\mu _{j}^{*}={\partial ln\mu _{j} \over \partial lnx}$
and
![]() $v_{2}={\mu _{2} \over \mu _{1}}$
is variance (second central moment of π).
$v_{2}={\mu _{2} \over \mu _{1}}$
is variance (second central moment of π).
![]() $R=-{1 \over 2}\left[{U''\left(\pi \right) \over U'\left(\pi \right)}\right]$
is the Arrow-Pratt relative risk aversion coefficient, which represents the risk attitude or the marginal risk premium, and measures the farmer’s willingness to substitute a change in the expected net returns for a change in investment risk or investment variability.
$R=-{1 \over 2}\left[{U''\left(\pi \right) \over U'\left(\pi \right)}\right]$
is the Arrow-Pratt relative risk aversion coefficient, which represents the risk attitude or the marginal risk premium, and measures the farmer’s willingness to substitute a change in the expected net returns for a change in investment risk or investment variability.
The certainty equivalent (CE) of the expected utility function can be written as:
So, R is the risk premium the farmer is willing to pay to avoid the variability in investment returns. This can be considered as the cost of private risk bearing or avoiding investment risk. Since the utility is positively related to returns from investment, the optimization problem in equation (7) is equivalent to maximizing the CE, and the first-order optimality condition is expressed as:
In combination with equation (8), the differentiation of marginal risk premium R with respect to x results in:
Equation (12) shows the effect of farm size on investment variability and measures the total impact on risk premiums. If plot size increases the investment variability, it has a positive marginal risk premium and vice-versa (Chavas, Reference Chavas2004). The above can be interpreted as the marginal risk effect of farm size, equal to the marginal mean net returns from investment. A farmer chooses the optimal farm size when equality occurs between marginal net returns from farm size and its marginal risk effect. The solution to this optimality condition gives us
The first part of equation (13) shows that the demand for bringing more land under operational holding by a farmer is a function of z, the vector of farmer-specific characteristics and site-specific factors, and the landownership status (s). The second part shows that the decision to put the optimal investment level depends on x, z, and landownership status(s).
4. Data and empirical framework
This study used the cross-sectional data compiled from India’s 77th round (January 2019–December 2019) of NSSO’s Situation Assessment Survey of Agricultural Households (SASAH, 2019–21).Footnote 4 The current round of NSSO has a sample of 45,714 farming households at the national level. Farm investment data was compiled by adding the expenses incurred on purchasing significant repair/improvement in the land, building for farm business, and machinery.Footnote 5 The explanatory variables include land ownership status.Footnote 6 farm size, farmers’ age, education, total credit (loan amount in cash or kind), access to irrigation, technical advice/assistance, awareness of minimum support price (MSP), access to crop insurance, rate of market orientation, and nonfarm income. The rate of market orientation is defined as the share of total crop output sold (in the local market, mandis, or through any other agencies) to the total value of the crop produced. Table 1 presents the definitions and descriptive statistics of the variables used in this study. We transformed the discrete variables into natural logarithms to avoid the possible skewed distribution of those variables.Footnote 7
Table 1. Definition of variables and descriptive statistics
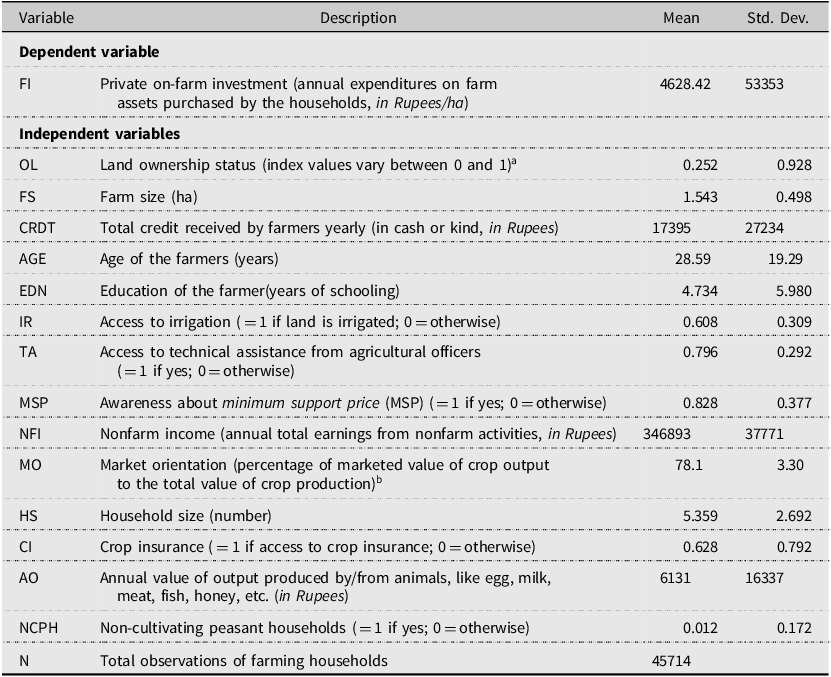
Source: NSSO’s 77th round –Situation Assessment Survey of AgriculturalHouseholds (SASAH), 2019.
a Defined as( the share of land leased-in. The values vary between 0 and 1. Here, 0 indicates pure tenants, and 1 indicates owner-operator. The specific terms of lease on which data were collected in the survey are: (i) for fixed money,(ii) for fixed produce, (iii) for share of produce, (iv) from relatives underno specified terms, and (v) under other terms.
bThe share is multiplied by 100 to give a percentage, and we add one to zero values (no market orientation). In logarithmic transformation, this value comes as zero. In normalization process, we add one to zero value and then take log transformation.
4.1. Empirical strategy
We adopt an empirical strategy based on our theoretical framework to understand the impact of land ownership and other socioeconomic and farm-specific variables on farm-level investment and investment variability. Since the theoretical model is based on the flexible moment approach developed by Antle (Reference Antle1983), where landownership is incorporated directly in the first and second moments, the empirical strategy is also based on this method. Thus, the impact of land ownership status and other socioeconomic variables on the mean investment function and investment variability is examined through the first and second moments.Footnote 8
The following model (Equation 14) estimates the mean investment function as follows:
where x i refers to farm size, z i refers to vectors of farm and farmer-specific characteristics, s i refers to land ownership status and u i is the error term. Finally, θ i is a vector of parameters to be estimated. To capture the variability of farm-level investment, the estimated errors from the above equation are obtained, and the squared values are regressed on the same explanatory variables to estimate the second moment of the farm investment as:
The estimation of the vector of parameters ϑ i in this model will show the effect of explanatory variables on the variability of farm investment. A risk-reducing factor carries a negative sign, and a risk-enhancing factor will have a positive coefficient.
4.2. Endogeneity issue
Many studies assume that land ownership status is exogenous because the land rights determine it. However, some recent studies (Ali et al., Reference Ali, Abdulai and Goetz2012; Brasselle et al., Reference Brasselle, Gaspart and Platteau2002; Paltasingh et al., Reference Paltasingh, Basantaray and Jena2022; Place and Otsuka, Reference Place and Otsuka2002) argue that tenancy arrangements and productivity-enhancing investments are jointly determined. Thus, it leads to the problem of endogeneity of land ownership status/tenure variable in equation (14). Hence, we need to test for the potential endogeneity of land ownership status. Following Wooldridge (Reference Wooldridge2015), we use the “control function approach” where, in the first step, we model landownership status(s i ) as a function of vectors of various explanatory factors ( z i and x i) and the instrument variable (IV i ) as given in equation (16):
where ϕ i is the parameter vector to be estimated and ω i is an error term. In the second step, the test involves writing the error term (u i ) in equation (14) as conditional on ω i , specifically as:
Substituting u i in equation (14) yields the conditional model as:
The test of endogeneity of s i is performed by testing the null hypothesis, H o : ϕ i = 0. Failing to reject the null hypothesis implies that the land tenancy variable is exogenous. The test involves estimating equation (16) with the control function approach for endogeneity (Wooldridge, Reference Wooldridge2015), where the instrument is modeled as one of the determinants of land tenure security, along with other explanatory variables. Then, we estimated the equation (18) in the second stage using the residuals in the first stage.Footnote 9 If the coefficient ϕ is significant, then the exogeneity of s i is rejected. The above method involves identifying an instrument for landownership status. The variable excluded from the second-stage regression model is a dummy variable indicating the household is a “non-cultivating peasant household” (NCPH). An NCPH earns some portion of its income or total income from nonfarm activities but not from cultivation.Footnote 10 We argue that this is a good instrument because NCPHsFootnote 11 are the households that own land but never cultivate it (Vijay, Reference Vijay2012). As Vijay (Reference Vijay2012) and Bhue and Vijay (Reference Bhue and Vijay2012) pointed out, a new class of landowners emerging in Indian agriculture own the land but do not cultivate it. Their primary source of income is nonfarming activities. One can argue that these are absentee landlords who mainly lease out their farm land, thus increasing the incidence of tenancy in Indian agriculture.Footnote 12 Therefore, the NCPH, being a relevant instrument, also satisfies the required exclusion restriction condition because being an NCPH does not affect investment directly.
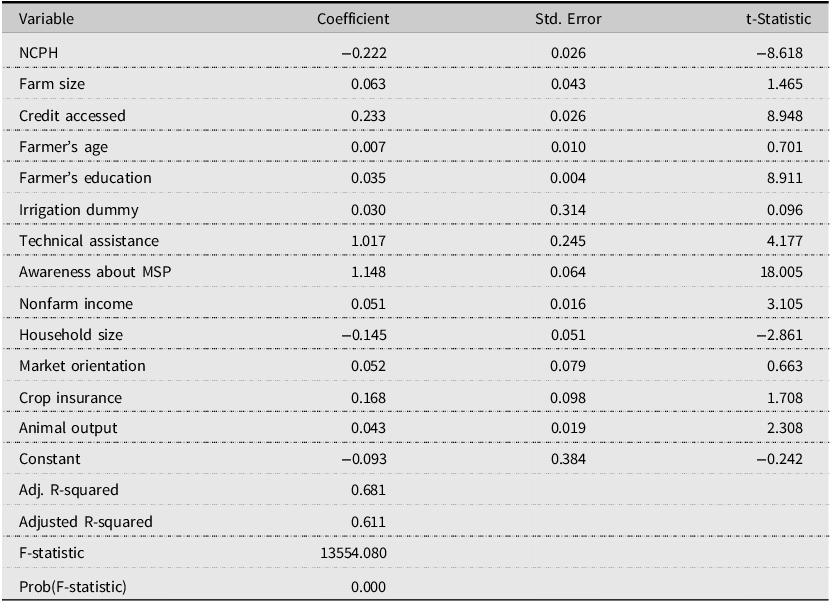
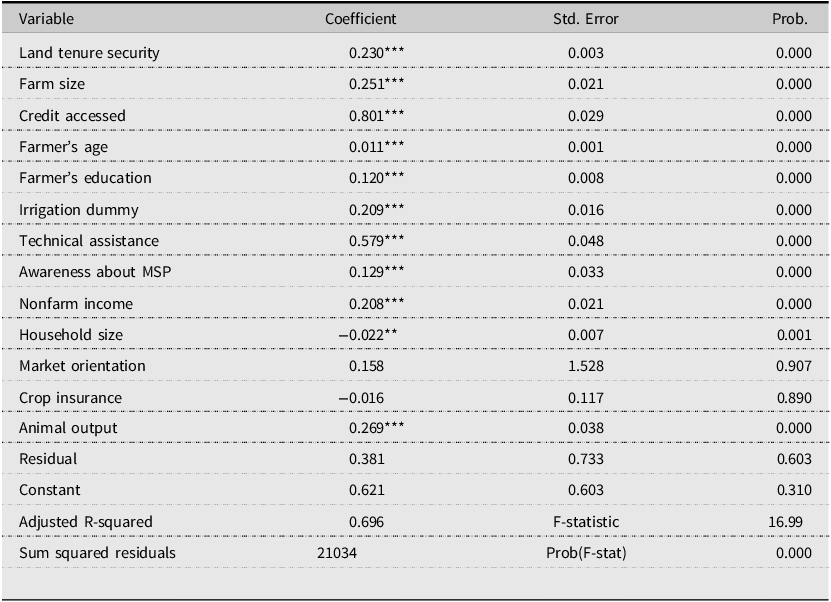
Tables 1A and 2A in the appendix present the first and second-stage results of the endogeneity test. The first-stage regression model (Eq. 16) shows the effects of household and farm-level characteristics and the instrument (NCPH) on land ownership status. We found that the dummy variable, NCPH, is negative and significantly influences landownership status, indicating that these households are more likely to lease out the land. In other words, land owned by families but not cultivated by them is more likely to be leased out, increasing tenancy in Indian agriculture. Using the F-statistic to evaluate the weakness of this instrument, we observe that the instrument is not weak as the F-statistic is sufficiently large.Footnote 13 The estimated results of the second-stage model (Equation 18) presented in Appendix Table 2A indicate that the residual (u) derived from the first stage is insignificant.
Table 2. Mean difference in key characteristics between owners and tenants
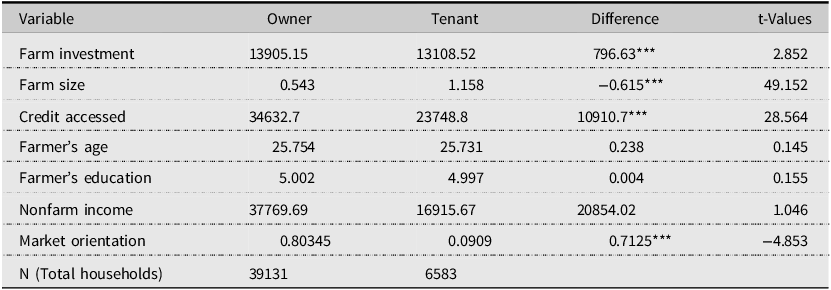
Notes: *** P < 0.01, ** P < 0.05, * P < 0.10. Units of variables are given in Table 1.
Source: Authors’ estimation from NSSO’s 77th round –Situation Assessment Survey of Agricultural Households (SASAH), 2019.
5. Results and discussion
A commonly used method of testing the Marshallian hypothesis is to compare on-farm investment under land ownership. This comparison provides a pretest to that hypothesis before the multivariate regression analysis. Here, we present the mean difference test (t-test) of farm-level investment and other inputs between owner-cultivators and tenants and, within the tenancy structure, between pure and partial tenants. Table 2 shows the mean difference between tenants and owner-cultivators. The farm-level mean investment under ownership cultivation is significantly higher than that of sharecroppers/tenants. This significant mean difference in farm-level investment between the two groups provides direct evidence that ownership security is positively associated with on-farm investment. Similarly, there are significant mean differences in the input uses and other characteristics. The significant mean difference is also observed among the inputs between farm size, credit access, and degree of market orientation of tenants and owner-cultivators. Regarding farm size, tenants’ mean operational landholding is substantially greater than owner-operators. But in all other cases, the owner-cultivators are better off than tenants.
The owner-operators have significantly more access to credit than tenants have. This result aligns with Feder and Onchan (Reference Feder and Onchan1987) and Ali et al. (Reference Ali, Abdulai and Goetz2012). They argued that access to institutional credit depends significantly on the capacity to put up collateral associated directly with land ownership. Likewise, the rate of market orientation is higher for owner-operators than tenants. Thus, land tenure security induces more farm investment and efficiency. Market participation positively determines gross returns or vice-versa, thus stimulating farm investment. Landownership status encourages farm-level investment through various direct or indirect channels. There is no significant difference between owner-operators and tenants in farmers’ education and farming experience (age as a proxy).
Table 3 presents the same comparison within the tenancy structure between pure tenants and partial tenants. Here, we consider partial tenants more secure than pure tenants because of their ownership rights in total operational landholding. The difference in on-farm investment between the two groups is about 5922.37 Indian rupees.Footnote 14 Among other input variables, there is a negative and significant mean difference between pure and partial tenants in farm size, access to credit, education, and rate of market orientation. The analysis indicates that partial tenants have a larger average farm size, greater access to credit, and relatively greater market participation than pure tenants. Only in nonfarm income do pure tenants have a higher average nonfarm income than partial tenants. However, the above simple comparison of means analysis suffers from a limitation. It does not include causal relationships between land tenure security and farm investment, and endogeneity issues have not been addressed. Further, the above analysis sheds no light on the effects of land tenure security on the variability in on-farm investment.
Table 3. Mean Difference in key characteristics betweenpure tenants and partial tenants
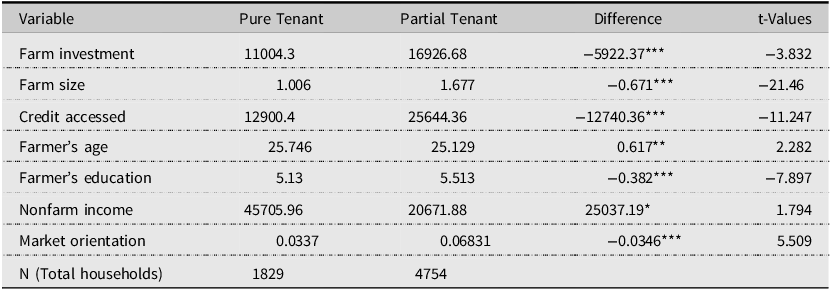
Notes: ***P < 0.01, **P < 0.05, *P < 0.10. Units of variables are given in Table 1.
Source: Authors’ estimation from NSSO’s 77th round –Situation Assessment Survey of Agricultural Households (SASAH), 2019-21.
5.1. Determinants of farm investment
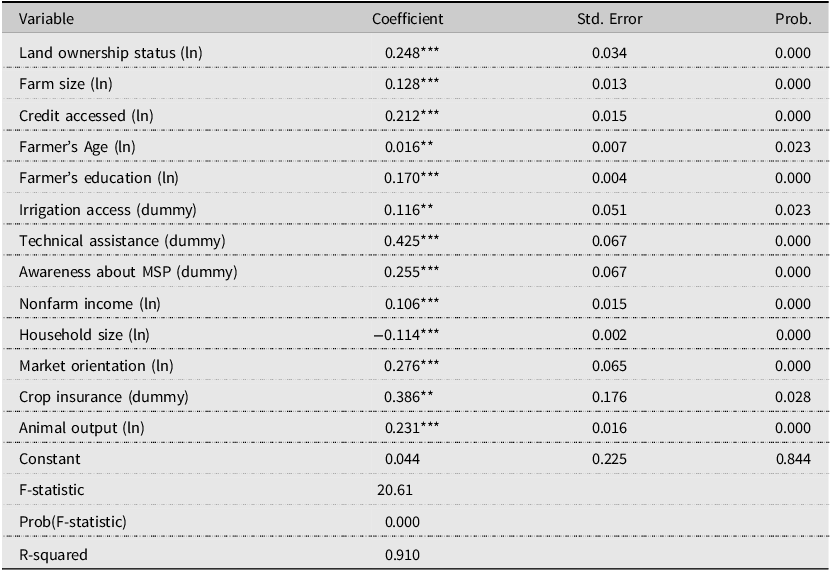
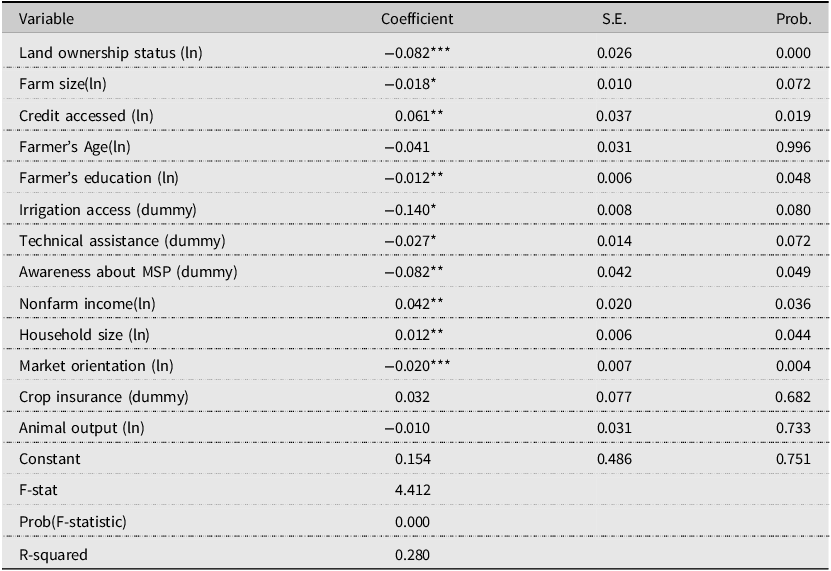
After finding no clear evidence of the endogeneity problem of land ownership status, we separately estimated the mean investment function and its variability. Tables 4 and 5 depict the results of determinants of on-farm investment function by estimating equation (14) and the determinants of farm investment variability in the second stage (Equation 15) after obtaining the second central moment. The statistics on the model’s fit (R-squared value and F-statistic) indicate a good overall model fit. The estimation procedure adopts White’s heteroscedasticity consistent robust standard errors. This is an appropriate method in a large cross-sectional sample that controls the heteroscedasticity problem. Note that explanatory and dependent variables are all transformed into natural logarithmic forms except the dummy variables. Results reveal that land ownership has a positive and statistically significant impact on the mean on-farm investment.Footnote 15 The coefficient of land ownership status is positive (0.248) and statistically significant, indicating that a 1% increase in land ownership (i.e., the intensity of land tenure security) increases on-farm investment by about 0.25%. Our finding confirms the “Marshallian inefficiency” hypothesis that tenure security induces more investment and supply of efforts from cultivators, which augments farm efficiency and productivity. Our result also is consistent with Cao, Bai, and Zhang (Reference Cao, Bai and Zhang2020), Paltasingh (Reference Paltasingh2018), Ma et al. (Reference Ma, Abdulai and Ma2018), Abdulai, Owusu, and Goetz (Reference Abdulai, Owusu and Goetz2011), Deininger and Ali (Reference Deininger and Ali2008), and Besley (Reference Besley1995). Cao et al. (Reference Cao, Bai and Zhang2020) empirically revealed the significant positive effects of secure farmland property rights on land attached and long-term investments in land in rural China. Paltasingh (Reference Paltasingh2018) examined Besley’s hypothesis (tenure security effect) in the agriculture of eastern India and found significant inducement effects of land tenure security on farm-level investment in adopting modern rice technology. Some other studies examined the same hypothesis in the case of African countries like Ghana, Uganda, and Burkina Faso and found similar results (Bambio and Agha, Reference Bambio and Agha2018; Besley, Reference Besley1995; Ngom et al., Reference Ngom, Damon and Whipple2023; Place and Otsuka, Reference Place and Otsuka2002; Donkor et al., Reference Donkor, Frimpong and Owusu2023). Our study confirms this hypothesis by using the pan-Indian data.
Table 4. Determinants of farminvestment in Indian agriculture
Notes: ***P < 0.01, **P < 0.05, *P < 0.10. The standard errors are White’s heteroscedasticity consistent standard errors and ln refers to natural logarithm.
Source: Authors’ estimation from NSSO’s 77th round on Situation Assessment Survey of Agricultural Households (SASAH), 2019-21.
Dependent variable = ln (on-farm expenditures on farm assets).
Table 5. Determinants of farm investment variability in Indian agriculture
Notes: ***P < 0.01, **P < 0.05, *P < 0.10. The standard errors are White’s heteroscedasticity consistent standard error; ln is the natural logarithm.
Source: Authors’ estimation from NSSO’s 77th round – “Situation Assessment Survey of Agricultural Households” (SASAH), 2019−21.
Dependent variable = ln (Squared residual).
The coefficient on education is positive and significant at the 1% level of significance. Results suggest that an additional 1% increase in years of schooling of farm household head increases on-farm investment by about 0.17%. Education helps farmers make sound and effective decisions, leading to more on-farm investment. Additionally, formal education is critical for adopting modern technology, farm production, farm management, and managerial skills (Paltasingh and Goyari, Reference Paltasingh and Goyari2018; Paltasingh, Reference Paltasingh2016). The coefficient of farm size is positive and statistically significant at the 1% significance level, suggesting that an additional hectare of land increases on-farm investment by about 0.128%. Our conclusion is consistent with Feder et al. (Reference Feder, Lau, Lin and Luo1992) and Abdulai et al. (Reference Abdulai, Owusu and Goetz2011).
The coefficient on credit amount is statistically significant at the 1% significance level. The estimated elasticity coefficient of 0.212 indicates that a 10% increase in credit increases on-farm investment by 2.12%. Our finding is consistent with Petrick (Reference Petrick2004), who found that institutional credit to the agricultural sector positively and significantly impacted private-sector investment. The farmer’s age has a positive and significant effect on farm-level investment. An explanation is that farmers tend to accumulate farming experience, knowledge, and wealth as they age. In addition, experienced and successful farmers know the farming situation in the area and are interested in expanding operations. In addition, Martey et al. (Reference Martey, Al-Hassan and Kuwornu2012) argue that older household heads might have more contacts, allowing them to find trading partners or technology to lower production costs.
The coefficient of access to surface irrigation is positive and statistically significant at the 1% level of significance. Results suggest that access to irrigation increases private on-farm investment by 0.116%. Our finding is consistent with Pender and Kerr (Reference Pender and Kerr1998), who found that access to irrigation had a significant effect on small holders’ investments in soil and water conservation methods in the semi-arid region of India. Awareness of MSP policy positively and significantly impacts the on-farm investment. Indeed, government support in farming in the form of guaranteed MSP for commodities signifies farm income stability, thus reducing riskiness in on-farm investment. Aditya et al. (Reference Aditya, Subash, Praveen, Nithyashree, Bhuvana and Sharma2017) argue that MSP provides security for long-term investment. Nonfarm income has a positive and highly significant impact on on-farm investment. This positive impact is in line with Ma et al. (Reference Ma, Abdulai and Ma2018), who empirically found that the effect of off-farm work stimulates agricultural production by increasing investments in productivity-enhancing inputs. For instance, Zhang et al. (Reference Zhang, Long, Li, Ge and Tu2020) found that off-farm employment increased the rate of chemical fertilizer intensity in plains areas of China.
The coefficients on the rate of market orientation and value of animal output (meats, milk, fish, honey, eggs) are positive and significant at the 1% level of significance. Results indicate that a 1% increase in the rate of market orientation and value of animal output increases on-farm investment by about 0.28% and 0.23%, respectively. The result of the positive and significant effects of the rate of market orientation is consistent with Strasberg et al. (Reference Strasberg, Jayne, Yamano, Nyoro, Karanja and Strauss1999), who found that agricultural household’s farm commercialization has a significant and positive impact on fertilizer use and productivity. On the other hand, as expected, household size negatively and significantly affects smallholders’ on-farm investment in India.Footnote 16
5.2. Determinants of investment variability
Table 5 presents parameter estimates of factors affecting investment variability at the farm level of Indian farmers.Footnote 17 A positive coefficient enhances on-farm investment variability, and a negative coefficient reduces on-farm investment variability. The negative coefficient of land ownership status (−0.08) is statistically significant at a 1% probability level. Results indicate that 1% rise in landownership status/security reduces the on-farm investment variability by 0.082%. The relative strength of the coefficient is small, but what is important is that secured land ownership rights reduce on-farm investment risks. Our finding is consistent with Besley (Reference Besley1995), Demsetz (Reference Demsetz and Demsetz2003), and Deininger and Jin (Reference Deininger and Jin2006), who found that farmland property rights decreased transaction costs and investment risk. Among the other significant factors that reduce the farm investment variability are farm size (−0.018), farmer education (−0.012), technical advice (−0.027), irrigation dummy (−0.140), awareness about MSP (−0.082), and market orientation (−0.020). Thus, findings reveal that educated smallholders who received technical advice and assistance maintain a persistent level of investment, reducing the variability of on-farm investment more than their counterparts. Farmers who seek technical advice are usually progressive farmers seeking ways to improve the viability and profitability of their farming operations (Paltasingh and Goyari, Reference Paltasingh and Goyari2018). Assured irrigation reduces production risk, stimulating on-farm investment and reducing its variability. Knowledge about the market and participation in the market also minimizes investment risks. The rate of market participation and awareness about crop prices encourages farmers to invest in the farm and increase profits, thereby reducing the variability in on-farm investment. Among all these variability-reducing factors, access to irrigation has a relatively bigger risk-reducing effect.
The estimated coefficients of credits (0.061), nonfarm income (0.042), and household size (0.012) are positive and statistically significant at the 5% significance level. Results suggest that loans or credit amounts enhance the on-farm investment variability. This may be because loans need to be repaid in the future, thus requiring farmers to think hard about investing additional resources in on-farm investment. Any additional funds or income would go toward the repayment of loans first. The coefficient of household size confirms that an increase in the farmers’ family size enhances the variability in farm investment. The coefficient is positive at 0.012 and statistically significant, indicating its variability-enhancing effect. This can be attributed to increased consumption expenditures associated with increased household size. This causes variability in farm investment as increased consumption expenditure affects farm investment in both ways. First, it siphons scanty resources off for required investment for smallholders. But at the same time, it may induce more investment because of the demand for food. However, the immediate effect is negative due to the diversion of funds for consumption. Similarly, nonfarm income also increases investment variability because the farmers having additional income sources may stimulate more or less investment depending on their dependency on agriculture. Large families are constrained and face higher investment risk because of increased consumption expenditures, leading to a decline in investment (Joshi, Reference Joshi2004) and a rise in investment risk.
6. Conclusion and policy implications
Land ownership affects both on-farm investments and the ability to finance the investments. This paper investigated the determinants of on-farm investment and variability in on-farm investment in Indian agriculture using cross-sectional data from the Situational Assessment Survey of Agricultural Households (77th round, January 2019–December 2019) of NSSO. The empirical evidence from this study revealed that land ownership security positively and significantly affected on-farm investment among farmers in India. In addition, farm size, amount of credit, farmer’s age, access to irrigation, awareness of government programs, nonfarm income, rate of market orientation, and value of animal output significantly affected farmers’ on-farm investments. Indeed, the study found that land security and access to technical assistance, farmer education, assured irrigation, and market participation reduced on-farm investment risk (variability of on-farm investment). Perhaps lessons to policymakers from this study are to design policies that encourage farmers to borrow from formal sources and policies that increase technical assistance to farmers. To this end, banks and other formal credit providers could engage in educational campaigns and financial training for farmers. Institutional credit expansion likely will be needed to finance on-farm investment.
The main policy implication inferred is that the government should frame legal policies to strengthen the tenurial status of tenant farmers. A secure tenancy encouraging smallholders to increase farm investment and efficiency has already been evidenced in West Bengal through the policy of “Operation Barga” (Banerjee and Ghatak, Reference Banerjee and Ghatak2004). So, in line with Operation Barga, there is a need for land tenancy reform in other regions of India to enhance agricultural productivity and production. Besides, based on the preceding analysis, we believe that concerted efforts are required to strengthen extension services and incentivize farmers to engage in training and awareness workshops regarding government agricultural policies. Furthermore, the resource-poor small and marginal farmers need to be provided with easy credit and brought within the network of crop insurance to protect them against the market and climatic risks. However, access to credit and crop insurance should be implemented appropriately, emphasizing the ease of getting compensation without any official hitch. On the other hand, the study revealed that household size negatively impacted on-farm investment in India.
The main limitation of the present study is that it has examined the issue of land tenure security and on-farm investment at the cross-sectional and aggregate level using pan-India data. However, a sub-national level analysis using the state or district level data would reveal the actual picture at the micro and meso levels. Investment risk may also be captured if we have time series data of many years. Technological progress, market conditions and various government policies also influence investment variability. We could not include all such variables due to a lack of suitable and relevant data. Future studies may try to fill those gaps.
Acknowledgements
The authors are thankful to the editor of the journal, three anonymous reviewers and Professor Pratap Singh Birthal for their insightful comments on the earlier drafts of this paper. All remaining errors are ours.
Data availability statement
The data that support the findings of this study are openly available in Government of India, Ministry of Statistics and Programme Implementation. Report on NSS 77th Round for Schedule- 33.1, January 2019 –December 2019, (Land and Livestock Holding of Households and Situation Assessment of Agricultural Households). https://mospi.gov.in/unit-level-data-report-nss-77-th-round-schedule-331-january-2019-%E2%80%93-december-2019land-and-livestock.
Authors’ credit
Conceptualization: N. A., A.K., K.R.P., P.G.
Methodology: N.A., K.R.P.
Software: N.A., K.R.P.
Formal Analysis: N.A., K.R.P., A.K., P.G.
Data Curation: N.A., K.R.P.
Writing-Original draft: N.A., K.R.P, A.K., P.G.
Review and editing: N.A., A.K., P.G., K.R.P.
Resources: P.G., A.K.
Supervision: A.K., P.G.
Financial support
This research received no specific grant from any funding agency, commercial or not-for-profit sectors.
Competing interests
All authors declare that they have no conflict of interest on any aspect of this work.
Appendix
Table A1. OLS results of determinants of land ownership status (1st stage)
Notes: ***P < 0.01, **P < 0.05, *P < 0.10, MSP is the minimum support price of crops in India.
Source: Authors’ estimation from NSSO-SASAH data, 2019.
Table A2. Determinants of farm investment (Second-stage results)
Notes: ***P < 0.01, **P < 0.05, *P < 0.10. The standard error is bootstrapped standard error, as White’s robust standard errors donot correct for the use of generated regressors on the mean investment equationin the final stage.
Source: Authors’ estimation from NSSO-SASAH data, 2019−21.


