

7.1 Introduction
Language is not static, and one of the benefits of corpus linguistics has been to identify changes in language use over time. For example, Leech and colleagues (Reference Leech, Hundt, Mair and Smith2009) and Baker (Reference Baker2017) have compared matched sets of written corpora which point to a set of major changes in English that could be characterised as densification (fitting increased information into less space), democratisation (avoidance of signalling hierarchies or prejudiced references to others), and informalisation (language which replicates features of informal face-to-face communication).
It can be useful to consider change over time within corpora relating to health as a way of revealing emerging linguistic patterns that can indicate new ways of conceptualising health conditions. A time-based analysis may also be able to show the impact on language of a key event such as the passage of a piece of health legislation or the availability of a new form of medication or therapy. In this chapter we will focus on three case studies of corpora relating to change over time – changing representations of obesity in newspapers, changes in patient feedback over time, and changes in language use about anxiety on an online forum.
Corpus approaches are well-suited for identifying a range of aspects of language change, as a wide number of features can be taken into account at once, and statistical tests will identify those which show the most impressive changes. Such approaches require the collection of texts from multiple points in time. Most corpus tools enable two corpora to be compared together easily, via the keywords technique, and if such texts are from different time periods and constitute matched sources, it would be possible to make claims about increases or decreases of a particular feature, although it should be borne in mind that a comparison of a small number of sampling points (e.g., two or three) does not allow us to express confidence that we are seeing a trend. In particular, if the sampling points are not from adjacent time periods (e.g., texts from only the years 1980 and 2000), we are essentially looking at ‘snapshots’ in time, and any observed increases or decreases may obscure a more complex picture if data had been collected from, say, 1985, 1990, and 1995.
An important question to consider when carrying out a corpus analysis of change over time is how to divide the corpora into time periods. There are a number of criteria to bear in mind. First, are there any significant events which would suggest that the corpus could be segmented into meaningful sections? Second, how many sections should be compared? Depending on the amount of text available, splitting data into numerous sections is likely to result in lower frequencies of many linguistic phenomena, meaning that it can be difficult to have confidence about whether differences in frequency are actually meaningful or due to chance. Third, how long should each time period cover? Studies could compare centuries, decades, years, months, weeks, or even days. However, there needs to be a reasonably clear justification for the length of time that is used to delineate the sub-corpus segments. This decision should be related to the data under consideration. In some contexts, language use around a health-related topic might develop very quickly, whereas in others, the pace may be very slow. For many health-related news topics, taking a corpus consisting of a year’s worth of articles and then comparing each month may not reveal much, unless there was a highly significant event relating to the topic during that year. Having segments that are too broad may make important aspects of change difficult to identify. For example, comparing corpora of nineteenth- and twentieth-century texts about mental illness against one another might risk obscuring the broad changes in perceptions of mental health that have occurred, especially in the twentieth century.
7.2 Patient Feedback: Identifying Increasing and Decreasing Lexical Items over Time
The first case study discussed in this chapter involves patient feedback. The NHS sends an annual survey to all patients who had received treatment relating to a diagnosis of some form of cancer. These surveys contain questions with sets of predetermined answers which patients can respond to by ticking a box, as well as three questions which allow patients to write their own answers as text. Thus, patients were asked ‘Was there anything good about your NHS cancer care?’, ‘Was there anything that could be improved?’, and ‘Any other comments?’. The answers to these three questions comprised our corpus. As the researchers had been given the answers to surveys sent out in 2015–18, there were four years of language data to compare.
Corpus tools are somewhat less developed for comparisons of multiple corpora, although it is possible to carry out workarounds using the keywords method (see Section 7.3) or to use a measure called the coefficient of variation, or CV (Figure 7.1; Baker, Reference Baker2017: 61–2), which essentially takes the mean of the relative frequencies of a linguistic item across three or more time-linked corpora (σ), divides it by the standard deviation of the item (μ), and multiples by 100. A high CV (close to 100) indicates an item which shows a great deal of variation across the corpora, whereas a low CV (close to 0) indicates items that have remained fairly stable in frequency over time.

Figure 7.1 The coefficient of variation.
The CV was used to compare lexical change over time across the 4 years of patient feedback. To identify the most important trends the researchers focussed on a set of high frequency words, stipulating that a word must occur at least 500 times in one of the time periods under examination in order to be considered for analysis. This resulted in a set of 721 lexical items. In order to identify candidate words, their total frequencies, and their individual frequencies across each of the 4 years, WordSmith Tools (Scott, Reference Scott2016) was used, being one of the most efficient corpus analysis tools for creating tables of multiple wordlists. First, individual wordlists for each (sub-)corpus were created. Then the option ‘Detailed Consistency’ was selected from the ‘Getting Started’ menu within the ‘WordList’ tool, and the four wordlists were chosen in order to obtain word frequencies for each corpus. This data was then exported into Microsoft Excel. In Excel, researchers first needed to calculate the relative frequencies of each word (for this study, occurrences per million words was used). Then the CVs for each word were calculated. This involved calculating the standard deviation for the standardised frequency of each word (the STDEV function in Excel), dividing this by the average of each word (AVERAGE function), and then multiplying by 100. If the frequencies of the four wordlists were given in columns B, C, D, and E in an Excel spreadsheet, then the formula to calculate the CV would be as follows:
=STDEV(B2:E2)/AVERAGE(B2:E2)*100
The words were then ordered according to their CV score and the words with the highest CVs which also showed a constant increase or decrease over time were identified. For example, ongoing has a frequency profile of 101.5, 102.2, 180.9, and 185.8 occurrences per million words over the 4 years – with each relative frequency being higher than the one before it – whereas food shows a constantly decreasing profile (554.5, 470.7, 453.5, and 405.0). These words, along with their relative frequencies and CVs, are shown in Table 7.1.
Table 7.1 Constantly increasing and decreasing high-frequency words over time in patient feedback
| 2015 | 2016 | 2017 | 2018 | CV | |
|---|---|---|---|---|---|
| Constantly increasing over time | |||||
| ongoing | 101.5 | 102.2 | 180.9 | 185.8 | 32.90 |
| follow-up | 108.9 | 116.1 | 127.8 | 193.1 | 28.23 |
| amazing | 397.0 | 502.2 | 616.2 | 709.6 | 24.22 |
| administration | 174.1 | 220.6 | 248.6 | 282.3 | 19.77 |
| NHS | 1,523.4 | 1,738.7 | 1,835.0 | 2,054.5 | 12.09 |
| process | 232.2 | 252.5 | 285.1 | 304.8 | 12.00 |
| journey | 117.9 | 132.2 | 145.2 | 156.3 | 11.71 |
| outstanding | 287.0 | 320.5 | 351.3 | 377.6 | 11.19 |
| none | 294.0 | 277.4 | 333.9 | 354.0 | 10.92 |
| cancelled | 139.6 | 159.7 | 145.8 | 178.0 | 10.92 |
| knowledgeable | 120.2 | 114.7 | 123.8 | 144.7 | 10.43 |
| grateful | 497.8 | 550.5 | 609.3 | 628.2 | 10.36 |
| compassionate | 118.5 | 121.0 | 140.4 | 144.7 | 10.16 |
| plan | 147.6 | 161.1 | 167.2 | 188.0 | 10.13 |
| issues | 147.0 | 153.9 | 163.8 | 164.7 | 10.12 |
| stage | 227.4 | 216.5 | 244.3 | 269.6 | 9.57 |
| Constantly decreasing over time | |||||
| food | 554.5 | 470.7 | 453.5 | 405.0 | 13.22 |
| wards | 317.7 | 280.2 | 269.1 | 239.3 | 11.72 |
| night | 451.2 | 438.0 | 377.3 | 370.4 | 10.09 |
| visits | 249.7 | 235.7 | 227.4 | 197.1 | 9.77 |
| drugs | 263.0 | 236.8 | 222.0 | 211.1 | 9.63 |
| attitude | 227.1 | 219.3 | 204.9 | 185.0 | 8.84 |
| ward | 2,037.6 | 1,932.8 | 1,761.1 | 1,676.8 | 8.81 |
The words in Table 7.1 were then subjected to a more detailed qualitative analysis, via samples of concordance lines (random samples of 100 lines for each word for each year were analysed), to try to identify their most typical uses and whether their uses had changed over time. A few illustrative findings from the analysis are given as follows.
Some of the increasing words indicate specific ways of making positive evaluations of staff that patients encountered (amazing, outstanding, knowledgeable, compassionate) and giving thanks (grateful). Additionally, the word none tended to be used in two ways, both of which were linked to positive evaluations. It often occurred in the phrase second to none, which was used in praise-giving. For example,
The care and treatment was second to none.
However, none also tended to occur on its own, and in more than 90 per cent of cases it was given as a short, explicit answer to the question ‘Was there anything that could be improved?’
NHS also tended to occur in positive feedback, often to indicate support for the NHS as an institution, sometimes in comments that acknowledge or allude to threats around it or funding issues.
Long live the NHS
I get very annoyed when I hear or read about people ‘bashing’ the NHS
With all the NHS cutbacks we hear about in the media I feel I was treated well and quickly
Some increasing words were used in mixed ways. For example, journey is another word which has increased over time. This word can refer to literal journeys (e.g., the journey from home to hospital and back again) or refer to the patient’s experience with cancer as a metaphorical journey. When journey was used in negative feedback, it usually involved complaints about literal journeys.
On follow up appointment there was no results given as they were inconclusive, it was a waste of 4 hour journey.
On the other hand, when journey was used in positive feedback, it tended to be metaphorical.
I was given booklets and leaflets to help me through this very difficult journey
An increasing word that was used in more negative contexts was cancelled, which usually occurred in complaints about appointments or operations being cancelled.
Operation cancelled once at end of one day waiting
Called to appointment where appointment cancelled without notification
In terms of words that decreased over time, many of these tended to occur in the context of patients writing about overnight stays: wards, ward, food, bed, night. These words are all more likely to occur in negative as opposed to positive feedback, particularly bed. Complaints about beds include lack of a bed for patients, not being able to adjust beds, disturbances from patients in other beds, or being too cold in bed. Complaints relating to the word night involve lack of night staff or problems with night staff, patients having a poor night’s sleep due to noise, or not getting home from appointments until late at night. The fact that such words have decreased over time would suggest that issues about overnight stays appear to have gradually improved between 2015 and 2018.
This study focussed on change in terms of words or lexical frequencies. However, it is possible to examine change in terms of other kinds of phenomena, such as fixed sequences of words (sometimes called lexical bundles or clusters) or part-of-speech categories. Tools like CLAWS7 (Constituent Likelihood Automatic Word-tagging System), which can be accessed through the online corpus analysis tool Wmatrix (Rayson, Reference Rayson2008), automatically classify the words in a corpus according to their part-of-speech, usually with accuracy rates of around 95–8 per cent. The system assigns a part-of-speech tag to each word from a predefined set of 137 tags (e.g., NN1 refers to a singular common noun while NN2 is a plural common noun). Considering changes over time in relation to frequencies of part-of-speech tags might enable researchers to identify patterns of language at the grammatical level as opposed to the lexical level.
In addition, Wmatrix assigns tags to words based on a set of semantic categories (using a second tagset called USAS), consisting of 21 higher-order tags which are subdivided into around 600 more fine-grained categories based on thesaurus definitions. For example, category G is ‘Government and Public’, while G2.1 is ‘Law and Order’ (consisting of words like court, rules, and legal) and G2.1 is ‘Crime’ (consisting of words like evil, corruption, and guilt). The system can be used to identify changing themes or topics across time-linked corpora, although care should be taken to ensure that words have been accurately assigned to categories, and in some cases, a more productive analysis might be one where the analyst has created their own categories and assigned relevant words to them. This would be useful in cases where the corpus contains lexis that the tagger does not recognise or assigns to inappropriate categories. Additionally, the categories in USAS may not fully capture the most meaningful semantic distinctions that the analyst wants to consider. USAS is able to recognise names of people but does not categorise them according to whether they are a politician, a sportsperson, or a news broadcaster, for example.
The CV approach to change over time tends to be more effective when there are three to five time periods to compare, and as noted earlier, it tends to work better when dealing with medium- to high-frequency phenomena (which is why comparing categories like grammatical tags can be productive). In the following section, we describe a different approach with more data collection points, where researchers created their own categorisation system (using a bottom-up approach), in order to examine changes in language over time relating to obesity.
7.3 Representations of Obesity: Identifying Changing Topics over Time and Considering the Annual News Cycle
In this section we discuss a project which involved examining representation around obesity in a 36-million-word corpus of British newspaper articles (see Chapters 2 and 3). The time span of this corpus was from 2008 to 2017, so the corpus contained a decade’s worth of articles taken from 11 UK national newspapers. This data was initially analysed by splitting the corpus into 10 sub-corpora, each consisting of a year’s worth of text. The analysis aimed to identify lexical items which had increased or decreased over time. In order to obtain a set of relevant terms, the whole corpus was compared against a reference corpus (in this case the 100-million-word British National Corpus), and a list of the top keywords was obtained. The relative frequencies of these keywords were then obtained for each of the 10 years of data, in order to identify words which had become more (or less) popular over time.
However, this resulted in a problem. The data across the 10 years of the newspaper corpus was not well-distributed. For example, in the year 2011, 2,564 articles were published, whereas 2016 had 6,734 articles. The vast majority of articles were published after 2013, meaning that when keywords were obtained from the whole corpus, the period from 2013 to 2017 greatly influenced the resulting list. The researchers wanted to take into account words that might have been keywords in the earlier part of the corpus, but many words did not appear as key because their frequencies were too low compared to the frequencies of words in the later time periods. To address this issue, it was decided to calculate keywords separately for each year of the corpus, by using a method called ‘the remainder method’. This involves taking a year of data (e.g., 2008) and obtaining keywords from it, using the remainder of the corpus as the reference corpus (in this case the data from 2009 to 2017). This technique was then carried out for each year of the corpus separately, resulting in 10 keyword lists. The researchers then took the top-100 keywords from each list and merged them together. Some keywords appeared in multiple lists, so when these repetitions were removed, the list contained 745 distinct keywords.
At this point, the researchers carried out concordance analyses to group the keywords into meaningful categories. For example, one category created was called ILLNESS, and keywords like cancer, diabetes, and inflammation were placed in it. The keyword heart was also placed in this category. Even though it appears to refer to a body part, concordance analysis showed that it was almost always used to refer to heart attacks. Having identified 27 categories of words in this way, the collective relative frequencies of the words in the categories was calculated, for each of the 10 years of the corpus, and this was plotted as a chart.
Figure 7.2 shows the relative frequencies for the category FOOD, which consisted of keywords like fruit, diet, and junk. This can be created in Microsoft Word or Excel by entering the numbers into a chart. A trendline (shown as a dotted line) can also be automatically added, showing that in general the relative frequency of FOOD words has increased over time. The equation of the trendline is also shown in Figure 7.2. The higher the first number, the steeper the gradient and thus the more dramatic the change over time. The score of 890.2 was the steepest gradient of the 27 categories observed. The second number in the equation (6,567.4 in this case) indicates the ‘intercept’, the first point of the trendline on the graph (in this case for the year 2008). The R2 value indicates how well the trendline fits the observed data, with a score of 1 being an exact fit. Here the R2 is 0.9049, showing that the data is a very close fit to the trendline. Charts like this were created for all 27 categories.

Figure 7.2 Relative frequencies of words categorised as FOOD over time in UK news articles about obesity.
Overall, the analysis found that two kinds of categories had increased over time. First, categories which framed obesity as due to personal responsibility had increased. This included FOOD, as we have seen, and another category called LIFESTYLE, which contained keywords like sleep, tobacco, and gardening. A second set of increasing categories referenced a biomedical explanatory model of obesity. This included the categories BIOLOGY (containing keywords like genes, cells, testosterone) and RESEARCH (experts, findings, study). Thus, excerpts like the following two tended to increase over time (and keywords are shown in bold typeface).
The desire for food in obese people is associated with brain activity that ‘rewards’ their behaviour, in a similar manner to substance addicts, the research suggests.
Further findings showed participants who skipped breakfast were more likely to have an overall unhealthy lifestyle, including poor diet, frequent alcohol consumption and smoking.
Categories which were decreasing over time included those labelled as SOCIAL (e.g., inequality, unemployment, discrimination), POLITICAL UK (e.g., government, MPs, political), BUSINESS (e.g., market, profits, commercial), and PLACES (NON-UK). The top category (having the lowest ‘x’ value) was PLACES UK (Britain, London, UK), often being used in contexts which compared statistics and policy around obesity in the UK with other countries, particularly involving news stories where the UK was described as not doing as well compared to other places. The following two excerpts show examples of keywords that were less likely to appear over time.
A leaked draft revealed that the government had dropped a target to halve childhood obesity in ten years along with more stringent incentives to make the food industry act.
Experts said many countries could learn from Scandanavian eating habits. Latest figures show obesity levels in Denmark are half those in Britain. In Denmark, 13.4 per cent of adults are obese, compared with 26.1 per cent in the UK.
The analysis indicates that during the period under study, UK press framing of obesity tended to be increasingly placed at the level of the individual – either due to lifestyle choices or biological and genetic factors that impact on our likelihood of gaining weight. On the other hand, framing of obesity tended to move away from structural and social factors, relating to the roles of government or industry. Newspapers also focussed less on obesity policy in other countries, particularly when such policies appear to have resulted in a more successful outcome than in the UK.
In order to explain these findings, it is first worth considering that between 1993 and 2010, there was generally an increase in the percentage of people with obesity in the UK, but in the following decade, the proportion remained fairly stable (Baker, Reference Baker2019: 4; Corrigan and Scarlett, Reference Corrigan and Scarlett2020: 6; National Statistics, 2018: 2; Scottish Government, 2017: 4). Fifteen per cent of adults had obesity in 1993, whereas this figure was around 25 to 27 per cent between 2010 and 2016. So, in the UK, obesity was historically high but also fairly stable during the period under study. It is also worth making a connection between the government in power in the decade under examination. From 2008 to 2010, there was a Labour-run government. In 2010 this was replaced with a Conservative-led alliance with the Liberal Democrat Party, and in 2015 the Conservatives won an election outright and remained in power for the rest of the time period under study. Although the British press is independent, the majority of the newspapers in the corpus supported the Conservative government, which explains, to an extent, why articles around government policy towards obesity have tended to reduce over time, in favour of articles which focus on individual responsibility. This has the twin function of avoiding criticism of the government’s role in failing to reduce high levels of obesity, while supporting the Conservative party’s neoliberal political goals that place more emphasis on the individual rather than social institutions to solve problems.
Both the patient feedback study (Section 7.2) and the press representation of obesity study (this section) considered change by comparing a set of sequential time periods (in this case each sub-corpus consisted of a single year of data). This method tends to be one of the most typical ways of looking at change over time, and depending on the time span that the data covers and the overall size of the corpus, we could make the sub-corpora represent smaller or larger periods of time accordingly. For example, if you have a corpus which covers 100 years of data, you might want to split the data into 10 decades or four periods of 25 years each. Another option would be to divide the data according to significant events. One way of dividing up the obesity news data, for example, could be into sections that denote the different governments mentioned previously.
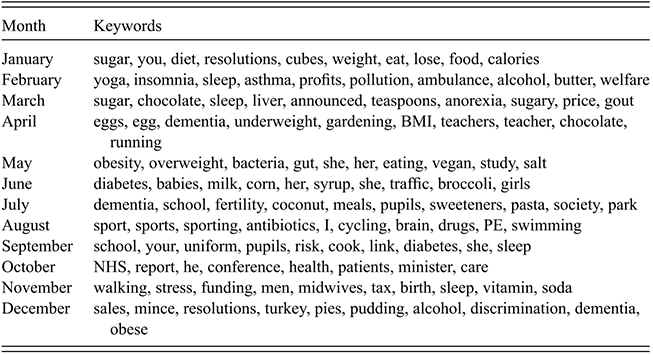
However, there are other ways to consider change over time, and for the remainder of this chapter we will examine three other perspectives. First, remaining with the newspaper corpus on obesity, we could consider time in terms of the annual news cycle. If we consider a single year, there will be a series of events which can be predicted to an extent. For example, for the UK, there will be cooler temperatures in November through February while the period of June through August is likely to be warmer. Additionally, children are likely to be out of school around Christmas, Easter, and the month of August, meaning that many families will travel on holiday during those periods. There are also routines in terms of the political calendar – with the annual budget occurring in March while party conferences usually take place in the autumn season. To an extent, these kinds of events are fixed, occurring around the same time each year. As a result, we could think of change over time in relationship to annual cycles, and instead of comparing the different years in a corpus we could compare the different months against one another.
A keywords analysis, again using the remainder method, was thus carried out to derive 12 sets of keywords (1 for each month). The top-10 keywords for each month are shown in Table 7.2 (only 8 keywords were obtained for September). For a keyword to qualify as truly being associated with a particular month, it was stipulated that it needed to occur at least 100 times. All keywords which appeared at least half of the time in only a single year of the corpus were also removed. This was to avoid cases where a single news story dominated a particular point in time – such cases tended not to be true ‘monthly’ keywords, whereas the researchers wanted to focus on keywords which cropped up every year in the same month.
| Month | Keywords |
|---|---|
| January | sugar, you, diet, resolutions, cubes, weight, eat, lose, food, calories |
| February | yoga, insomnia, sleep, asthma, profits, pollution, ambulance, alcohol, butter, welfare |
| March | sugar, chocolate, sleep, liver, announced, teaspoons, anorexia, sugary, price, gout |
| April | eggs, egg, dementia, underweight, gardening, BMI, teachers, teacher, chocolate, running |
| May | obesity, overweight, bacteria, gut, she, her, eating, vegan, study, salt |
| June | diabetes, babies, milk, corn, her, syrup, she, traffic, broccoli, girls |
| July | dementia, school, fertility, coconut, meals, pupils, sweeteners, pasta, society, park |
| August | sport, sports, sporting, antibiotics, I, cycling, brain, drugs, PE, swimming |
| September | school, your, uniform, pupils, risk, cook, link, diabetes, she, sleep |
| October | NHS, report, he, conference, health, patients, minister, care |
| November | walking, stress, funding, men, midwives, tax, birth, sleep, vitamin, soda |
| December | sales, mince, resolutions, turkey, pies, pudding, alcohol, discrimination, dementia, obese |
Concordance analyses of the keywords (shown in the following examples, in bold print) indicate how obesity tends to be framed differently throughout the year. For example, in January there is a focus on weight loss through dieting, along with losing weight as part of New Year’s resolutions, whereas in February and March, stories about lack of sleep being responsible for obesity tend to be more common.
The diet has you eat foods that the medical literature suggests are good for the brain. (Independent, 6 January 2016)
One in eight Brits sleep for less than six hours and insomnia has been linked to obesity, heart disease and cancer. (The Sun, 26 February 2013)
August has more stories relating to weight loss via participation in sports, perhaps as a result of good weather at this time of year.
Sports like handball are fun, easy, cheap and social. If we can encourage children to do more sport at school, it will help them realise playing sport is fun, not boring. (The Sun, 7 August 2012)
October contains stories which relate obesity to government policy, as the news reports on speeches at party conferences.
Tories blasted for railing against child obesity at party conference sponsored by a sugar firm. (Mirror, October 2017)
The analysis shows how different ways of framing obesity shift in and out of focus as a year progresses, with responsibility around obesity more likely to be placed at the personal level at certain times of year or linked to government policy at other points. The result is a somewhat inconsistent form of messaging, with suggestions around weight loss also fluctuating between different types or amounts of physical activity (sleeping in February, playing sports in August, walking in November) and/or dieting. It could be argued that an effective way of reducing obesity would be to follow a consistent routine, rather than putting one’s metabolism and body under stress for short periods by engaging in periods of overeating followed by diets, or engaging in sporadic exercise routines which change across the year. One finding which emerged from this study is that the news cycle’s imperative to continuously report new angles on a topic, coupled with seasonal trends, is perhaps likely to inadvertently hinder some people’s efforts to lose weight.
Obviously, not every corpus study is going to reveal interesting differences as the result of annual cycles, and several years of corpus data would need to be available in order to gain a sense of the repetition of the cycle. We would encourage readers to think creatively when considering change over time, though, and in the final section of this chapter, we describe some other ways that change can be conceptualised.
7.4 Anxiety Forum: Age and Level of Experience as Types of Time
The third case study in this chapter involves two other ways of considering change over time, relating to a 21-million-word corpus of online forum posts about anxiety. These posts were made between 2012 and 2020, and one way which the researchers analysed change over time in the corpus was to consider how words and word categories increased or decreased from 1 year to the next, using techniques already described in the previous sections. However, they also considered change over time in two other ways. The first was to think about the age of the participants, while the second was to look at the length of time that a participant had been engaging with the forum. We will first consider the age of participants.
The vast majority of contributors to the forum only posted for a few months, so the age at the time they posted was fairly static. Therefore, the forum posts could be divided into different age groups and compared against one another. Here, change over time is conceived as being related to the age of each person who had contributed to the corpus (i.e., in the number of years).
When the researchers obtained the corpus data, it was accompanied by a substantial amount of metadata which had been derived from forum users’ profile information, including sex, country of residence, ethnicity, and age. Not every person who created a profile provided information about all of these aspects, and for the category of age, only 56 per cent of forum users did so. Of those who did give their age, the majority were aged between 20 and 70. The researchers thus decided to reduce the corpus slightly, to consider posters between these two ages and then divide them into groups for comparison. Assigning people to age groups is an arbitrary practice, to an extent. This was done very simply, in terms of decades (e.g., 20s, 30s, 40s), in order to facilitate a manageable number of sub-corpora (six in total) for comparison. The remainder method, described earlier, was used to obtain keywords for each of these age groups. So, for the 20s age group, the posts of everyone aged 20–9 was compared against the posts made by everyone aged 30 and above, and this was done for each age group. Keywords were then examined through collocate and concordance analyses in order to group similar keywords into themes and to also gain a better impression regarding how each age group used the words under examination.
A potential issue with this approach related to prolific posters. A small number of posters tended to dominate the forum at different points in time, and their idiosyncratic uses of language resulted in large numbers of keywords appearing for each age group. While such keywords tell us something interesting about individual posters, it is not perhaps fair to say that they are typical of the language use of a particular time period or age group, so keywords that were used 50 per cent or more by a single poster were removed. Additionally, keywords that referred to people’s usernames were removed. Many usernames had already been removed, through an automatic tool, prior to the researchers receiving the corpus, but some had escaped detection.
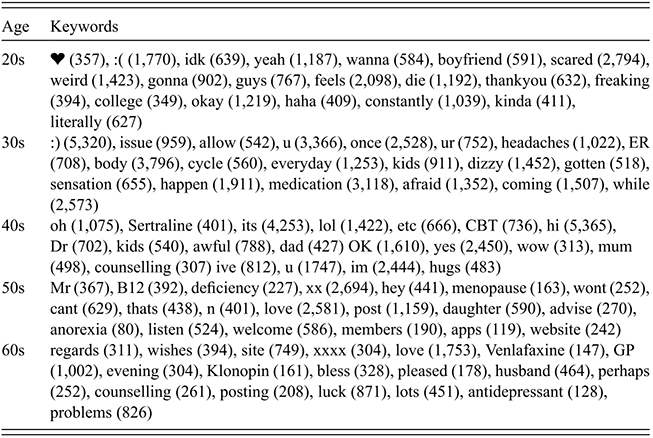
The analysis was carried out in Sketch Engine, and the 20 strongest keywords for each age group are shown in Table 7.3 (with the frequencies for that age group provided in brackets).
| Age | Keywords |
|---|---|
| 20s | ❤ (357), :( (1,770), idk (639), yeah (1,187), wanna (584), boyfriend (591), scared (2,794), weird (1,423), gonna (902), guys (767), feels (2,098), die (1,192), thankyou (632), freaking (394), college (349), okay (1,219), haha (409), constantly (1,039), kinda (411), literally (627) |
| 30s | :) (5,320), issue (959), allow (542), u (3,366), once (2,528), ur (752), headaches (1,022), ER (708), body (3,796), cycle (560), everyday (1,253), kids (911), dizzy (1,452), gotten (518), sensation (655), happen (1,911), medication (3,118), afraid (1,352), coming (1,507), while (2,573) |
| 40s | oh (1,075), Sertraline (401), its (4,253), lol (1,422), etc (666), CBT (736), hi (5,365), Dr (702), kids (540), awful (788), dad (427) OK (1,610), yes (2,450), wow (313), mum (498), counselling (307) ive (812), u (1747), im (2,444), hugs (483) |
| 50s | Mr (367), B12 (392), deficiency (227), xx (2,694), hey (441), menopause (163), wont (252), cant (629), thats (438), n (401), love (2,581), post (1,159), daughter (590), advise (270), anorexia (80), listen (524), welcome (586), members (190), apps (119), website (242) |
| 60s | regards (311), wishes (394), site (749), xxxx (304), love (1,753), Venlafaxine (147), GP (1,002), evening (304), Klonopin (161), bless (328), pleased (178), husband (464), perhaps (252), counselling (261), posting (208), luck (871), lots (451), antidepressant (128), problems (826) |
Subsequently, a more detailed concordance and collocates analysis of the keywords in Table 7.3 indicated that posters in their 20s tended to take on an advice-seeking role in the forum, and also tended to characterise their anxiety using much more extreme forms of language than older people.
i just remember being in his car and it cold outside and just feeling like a little mouse in a trap. thats literally what i am, a little mouse and the world is the trap and i want out (20s)
I constantly check my body in a mirror I have no clue how many times a day (20s)
And the dreams make no sense at all or they’re about what gives me anxiety then I’ll wake up in the middle of the night scared and thinking I’m gonna die. (20s)
On the other hand, older posters tended to take on a more supportive, advice-giving role, although different forms of advice tended to be given, depending on the age of the poster: for example, those in their 30s were more likely to recommend different forms of medication, whereas those older than 40 tended to recommend counselling. There were differences in the ways that anxiety was conceived, with those in their 30s referring to issues, while people in their 60s talked about problems.
Knowing your past focus on health issues, it sounds like an anxiety issue. (30s)
Sounds like you’ve got problems? I hope you will be able to resolve them, but don’t forget we are all here to help (60s)
This may appear like a ‘cosmetic’ difference, although it was found that across the whole corpus issues tended to collocate with words which had a discourse prosody for importance (important, key, major, serious, critical) and acknowledgement (address, raise, discuss, facing) rather than resolution, whereas problems tended to have a discourse prosody which suggested something had the capacity to be solved (solve, solving, solved, solution, fix, address, resolve). In order to further interpret and explain the findings, the full analysis (see Collins and Baker, Reference Collins and Baker2023) went beyond the anxiety forum corpus to consider the ways that younger people use language more generally by consulting a spoken reference corpus, as well as taking into account recent societal developments such as the popularity of social media and various increasing pressures on young people.
Moving on to the final way that was considered, change over time related to the amount of time that a person has spent on the forum. In the anxiety forum, about a third of posters only made a single post, whereas almost 80 per cent made fewer than 10 posts and about 8 per cent made between 10 and 20 posts. About 12 per cent of posters made more than 20 posts.
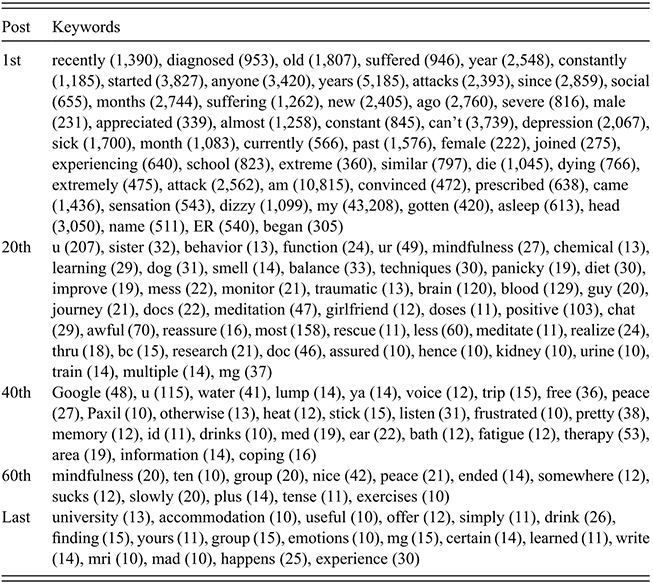
It is interesting to consider how people’s roles changed as they continued to interact with the forum, and how this might be reflected through their language use. Sub-corpora were therefore created of people’s first, twentieth, fortieth, sixtieth, and final posts to the forum, and then keywords were derived and examined via concordance analyses. In order to identify changes in the ‘journey’ that people make as they interact with the forum, the sub-corpus containing the first posts that people made was compared against all of the other posts to derive keywords. This was also done for the 20th, 40th, 60th, and final posts that people made. (The keywords are shown in Table 7.4, with their frequencies in brackets.)
| Post | Keywords |
|---|---|
| 1st | recently (1,390), diagnosed (953), old (1,807), suffered (946), year (2,548), constantly (1,185), started (3,827), anyone (3,420), years (5,185), attacks (2,393), since (2,859), social (655), months (2,744), suffering (1,262), new (2,405), ago (2,760), severe (816), male (231), appreciated (339), almost (1,258), constant (845), can’t (3,739), depression (2,067), sick (1,700), month (1,083), currently (566), past (1,576), female (222), joined (275), experiencing (640), school (823), extreme (360), similar (797), die (1,045), dying (766), extremely (475), attack (2,562), am (10,815), convinced (472), prescribed (638), came (1,436), sensation (543), dizzy (1,099), my (43,208), gotten (420), asleep (613), head (3,050), name (511), ER (540), began (305) |
| 20th | u (207), sister (32), behavior (13), function (24), ur (49), mindfulness (27), chemical (13), learning (29), dog (31), smell (14), balance (33), techniques (30), panicky (19), diet (30), improve (19), mess (22), monitor (21), traumatic (13), brain (120), blood (129), guy (20), journey (21), docs (22), meditation (47), girlfriend (12), doses (11), positive (103), chat (29), awful (70), reassure (16), most (158), rescue (11), less (60), meditate (11), realize (24), thru (18), bc (15), research (21), doc (46), assured (10), hence (10), kidney (10), urine (10), train (14), multiple (14), mg (37) |
| 40th | Google (48), u (115), water (41), lump (14), ya (14), voice (12), trip (15), free (36), peace (27), Paxil (10), otherwise (13), heat (12), stick (15), listen (31), frustrated (10), pretty (38), memory (12), id (11), drinks (10), med (19), ear (22), bath (12), fatigue (12), therapy (53), area (19), information (14), coping (16) |
| 60th | mindfulness (20), ten (10), group (20), nice (42), peace (21), ended (14), somewhere (12), sucks (12), slowly (20), plus (14), tense (11), exercises (10) |
| Last | university (13), accommodation (10), useful (10), offer (12), simply (11), drink (26), finding (15), yours (11), group (15), emotions (10), mg (15), certain (14), learned (11), write (14), mri (10), mad (10), happens (25), experience (30) |
The qualitative analysis of keywords through concordancing found that posters initially sought advice and provided their personal histories.
Does anyone know how I can get my life back? Be greatly appreciated. (1st post)
hi everyone i am new here my name is x i am male from egypt 28 years and i think i have anxiety since i was 16. (1st post)
As time went on, they increasingly took on an emotionally supportive or advice-giving role:
Hi that’s awful that your psychiatrist just told you to stop taking them. (20th post)
They were also more likely to suggest remedies to anxiety that were based on a non-medicalisation framework:
I listen to mind calming music too which helps me massively to relax. (40th post)
Going out is my coping mechanism even if I do not feel like it or nervous, or apprehensive. (40th post)
It is interesting to note that for people’s 20th posts, two linked keywords were journey (which metaphorically conceptualised the poster’s experience with anxiety) and learning (a verb which indicates the continuous or progressive tense), whereas for people’s final posts, the keyword learned (past tense) was used to provide a summary of the poster’s journey, indicating they felt they had made progress and were unlikely to need the group’s continuing support.
I am still learning to improve what I use and add in a new technique occasionally as well. (20th post)
Learning what works for you is a very personal journey but you sound like you know exactly what I mean (20th post)
I’m back to my old self again, thank God! It was a rough 3 months for me. I’ve been going to therapy since January and have learned to just accept the anxiety and the symptoms. (final post)
While most posters did not make it to their 60th post (indeed, most did not make it to 10 posts), the analysis indicates an interesting sense of progression for the more established posters, in terms of their changing roles in the forum, offering a different perspective on change over time.
7.5 Conclusion
This chapter explored how change over time can be conceived in multiple ways, and analysts are encouraged to not only think about dividing their corpus into years or decades but consider other aspects, such as the age of the text producer(s), repeated cycles (such as the annual cycle), or the length of time that a contributor has been involved in contributing towards an online forum.
The chapter has also shown how different techniques can be used to compare multiple time periods, including the coefficient of variation (CV), the remainder method of keyness, and the use of equation-based graphs and trendlines. Perhaps an unfortunate aspect of most current corpus software is that it does not easily provide procedures for comparing multiple corpora in order to examine change over time (although Sketch Engine’s ‘Trends’ function is an exception). Therefore, it is often necessary to supplement the corpus tools with other kinds of software, like Excel or R. The importance of going beyond the corpus, to consider different kinds of social and historical context, should not be understated, and we would recommend that corpus analysts who want to consider change over time also spend some time engaging with frameworks like Resigl and Wodak’s Discourse Historical Analysis approach (Reference Reisigl and Wodak2001) as a means of explaining their findings.


 Open access