


1. Introduction
Carbon taxes remain central to global efforts to decarbonise economic activity and mitigate environmental externalities (Bashir et al., Reference Bashir, B, Bilal and Bashir2021). Following the 2015 Paris Agreement (COP21) and subsequent climate summits (COP28, COP29), countries are expected to adopt low-carbon development strategies to curb greenhouse gas (GHG) emissions (Tan et al., Reference Tan, Yang, Irfan, Ding, Hu and Hu2024). Yet, concerns persist that carbon tax rates high enough to yield environmental benefits may create economic distortions, particularly depending on their design (Oueslati, Reference Oueslati2014). To mitigate this, it is often proposed that carbon tax revenues be recycled to lower other distortionary taxes. If such a policy reduces both emissions and existing tax burdens, it yields what is commonly termed a double dividend (Bosello et al., Reference Bosello, Carraro and Galeotti2001), typically defined in terms of employment or welfare improvements.
While employment and welfare are desirable outcomes, low-income countries (LICs) face a more fundamental fiscal challenge: limited tax base and persistent revenue shortfalls (Besley and Persson, Reference Besley and Persson2014; Okunogbe and Santoro, Reference Okunogbe and Santoro2023). For decades, LICs have struggled with tax-to-GDP ratios stagnating just above 10 per cent, compared to over 30 per cent in high-income countries (OECD, 2024). In such settings, expanding the tax base itself is a vital policy outcome. We therefore propose a third variant of the double dividend hypothesis: the tax base double dividend, where environmental tax reform delivers both ecological benefits and broader revenue mobilisation.
This framing complements, rather than replaces, the traditional double dividend concept (Bosello et al., Reference Bosello, Carraro and Galeotti2001; Freire-González, Reference Freire-González2018). It reflects the fiscal constraints of LICs, where broadening the tax net is often more politically feasible than raising statutory rates. Our conceptualisation aligns with early insights in public economics which argued that levies on externalities can serve both corrective and fiscal purposes (Tullock, Reference Tullock1967). We introduce this formulation to reflect the dual objectives of environmental integrity and sustainable revenue in resource-constrained economies.
The double dividend hypothesis has been debated for over three decades (Pezzey and Park, Reference Pezzey and Park1998; Bashir et al., Reference Bashir, B, Bilal and Bashir2021), but findings remain mixed and context-dependent (Dabor et al., Reference Dabor, Eguasa, Wilson and Aggreh2024). Some studies in the EU and US have questioned the presence of any dividend (Carraro et al., Reference Carraro, Galeotti and Gallo1996; Glomm et al., Reference Glomm, Kawaguchi and Sepulveda2008; Arbolino and Romano, Reference Arbolino and Romano2014), while others report partial or conditional outcomes (Oueslati, Reference Oueslati2014). More recent literature has even proposed triple or multiple dividends, emphasising the importance of revenue recycling and policy design (Ciaschini et al., Reference Ciaschini, Pretaroli, Severini and Socci2012; Ekins, Reference Ekins and O'Riordan2014; Pereira et al., Reference Pereira, Pereira and Rodrigues2016). However, as Bashir et al. (Reference Bashir, B, Bilal and Bashir2021) and Dabor et al. (Reference Dabor, Eguasa, Wilson and Aggreh2024) point out, most of this literature is based in high-income countries and may not generalise to LICs due to structural differences in labour markets, informality and administrative capacity.
Compounding this, LICs face additional fiscal vulnerabilities due to global trade liberalisation. Trade tax dependence remains high, with customs duties comprising up to 14 per cent of total tax revenue in Africa – far above other regions (Baunsgaard and Keen, Reference Baunsgaard and Keen2010; Okunogbe and Santoro, Reference Okunogbe and Santoro2023). Uganda exemplifies this pattern: trade taxes account for nearly 50 per cent of total revenue (URA, 2019), with automobile imports forming a major component. In 2018, Uganda implemented a decarbonisation tax reform targeting second-hand vehicle imports – an area with significant customs exposure (Government of Uganda, 2018). Given the country’s reliance on such imports, the reform had the potential to shift both revenue and emissions patterns in meaningful ways.
Despite extensive literature on carbon taxation in advanced economies, LICs confront a distinct configuration of structural challenges and policy opportunities. Administratively, most LICs face capacity deficits that limit the implementation of sophisticated carbon pricing mechanisms. Tax enforcement is weakened by informality, porous borders and limited digital infrastructure (Baunsgaard and Keen, Reference Baunsgaard and Keen2010; Okunogbe and Santoro, Reference Okunogbe and Santoro2023). Politically, fuel and vehicle taxes often provoke public resistance, especially when perceived as regressive or disconnected from visible service delivery (Timilsina and Dulal, Reference Timilsina and Dulal2011; Okunogbe and Tourek, Reference Okunogbe and Tourek2024). Moreover, environmental externalities are frequently deprioritised relative to urgent fiscal needs, given chronically low tax-to-GDP ratios and dependency on aid (Occhiali, Reference Occhiali2024).
Yet within these constraints lie important opportunities. First, many LICs still rely heavily on trade taxes, making import-based environmental levies administratively tractable and comparatively enforceable (Timilsina et al., Reference Timilsina, Dissou, Toman and Heine2024). Reforms targeting high-emission imports – like older vehicles – can yield relatively large environmental gains at low marginal cost, due to the dominance of second-hand, high-pollution technologies (Ayetor et al., Reference Ayetor, Mbonigaba, Ampofo and Sunnu2021). Second, by embedding environmental objectives into already functioning customs systems, such instruments can support domestic resource mobilisation without increasing statutory tax rates or requiring broad behavioural change (Freire-González, Reference Freire-González2018). Finally, where properly sequenced and communicated, such reforms can serve as political entry points for broader environmental tax integration (Ambareen, Reference Ambareen2023). It is in this space – between fiscal constraint and environmental urgency – that the tax base double dividend offers conceptual and empirical relevance: a formulation tailored to LICs that links ecological improvements with the strategic expansion of revenue capacity.
This study contributes to the intersection of environmental taxation and development economics by proposing and testing the tax base double dividend hypothesis. Specifically, it examines the effects of Uganda’s 2018 environmental levy reform using administrative microdata on all motor vehicle imports, offering the first empirical evidence of this dividend in an LIC setting. The paper also contributes to broader strands of literature, including environmental tax reform, green fiscal policy and trade-related carbon taxation (Bosquet, Reference Bosquet2000; Freire-González, Reference Freire-González2018; Tan et al., Reference Tan, Wu, Gu and Liu2022). While these literatures are rich in high-income contexts, they remain sparse in LICs – particularly with respect to structural constraints, globalisation pressures and institutional fragility (Adam, Reference Adam2009; Okunogbe and Santoro, Reference Okunogbe and Santoro2023; Timilsina et al., Reference Timilsina, Dissou, Toman and Heine2024). By grounding our analysis in real-world customs data and institutional features, we aim to extend the double dividend debate into underrepresented settings and contribute actionable policy insights.
The remainder of the paper is structured as follows: Section 2 describes the institutional setting, data and identification strategy. Section 3 presents the empirical results and draws policy lessons for LICs. Section 4 concludes with key findings and their implications for environmental tax design and revenue mobilisation in low-income settings.
2. Institutional setup, identification strategy and data
2.1. Reform context and empirical design
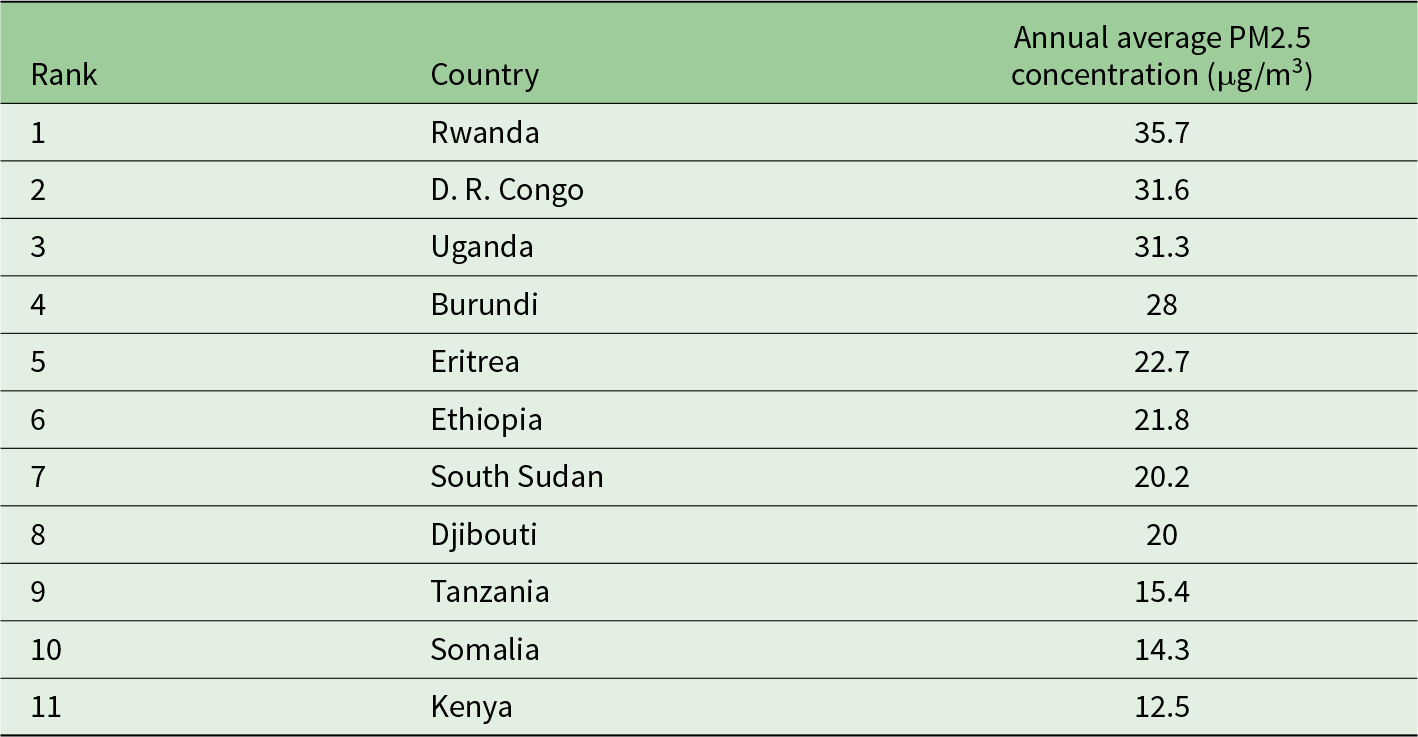
Transport is the fastest-growing fossil-fuel CO₂ emitter globally, accounting for 24 per cent of direct emissions (Ko et al., Reference Ko, Kim, Chung, Myung and Park2019). Air pollution causes around 9 million deaths annually, 85 per cent of them in developing countries; in Africa alone, it caused 1.1 million deaths in 2019 (Fisher et al., Reference Fisher, Bellinger, Cropper, Kumar, Binagwaho, Koudenoukpo, Park, Taghian and Landrigan2021). Though Africa has the world's lowest motorisation, its average PM2.5 emission factor (97.4μg/m3) exceeds the global average (82.3μg/m3), largely due to its high share of used vehicles (over 60 per cent of 72 million vehicles). These emit more than 40 per cent of the continent’s transport-related CO₂, with Uganda ranked among the top ten used-vehicle importers in Africa (Senyonyi, Reference Senyonyi2018) and third worst in ambient air pollution in Eastern Africa, following the Democratic Republic of the Congo and Rwanda (World Health Organisation, 2024). These rankings are reflected in the regional PM2.5 concentration levels shown in Table 1.
Table 1. Worst ambient air pollution in Eastern Africa

Source: Authors’ compilation based on World Health Organisation (2024) data.
To address environmental and road safety concerns, Uganda enacted the 2018 Traffic and Road Safety Act (Amendments), which came into effect on 1 July 2018. This reform introduced four key changes: first, a ban on the importation of vehicles that are 15 years or older; second, an expansion of the environmental levy exemption window from vehicles aged 0–5 years to those aged 0–8 years; third, an increase in the levy imposed on older vehicles, raising it from 35 per cent to 50 per cent of the vehicle’s cost, insurance and freight (CIF) value; and fourth, an extension of the levy to a broader range of vehicle categories, including goods vehicles (Government of Uganda, 2018).
This reform lends itself well to causal estimation for two main reasons. First, it was preceded by a widely publicised legislative process that included industry consultations and extensive media coverage. This broad dissemination likely ensured that behavioural responses occurred contemporaneously with the policy change, making them observable and measurable. Second, the reform introduced clear inter-category variations, particularly between passenger and goods vehicles, which enhances identification. Specifically, the 15-year import ban applied exclusively to passenger vehicles, leaving goods vehicles unaffected. The expansion of the exemption window to 0–8 years created a sharp discontinuity in the levy rate – dropping from 35 per cent to 0 per cent – while vehicles aged 9–10 years experienced an increase in the rate to 50 per cent. Vehicles aged 10–15 years retained the 50 per cent levy, offering a built-in internal control group. Additionally, the introduction of a new 20 per cent levy on previously exempt goods vehicles contrasted with ambulances, which continued to be exempt, further reinforcing cross-category variation.
These discrete shifts support a difference-in-differences (DiD) identification strategy. Vehicle categories not affected by a given reform act as counterfactuals for those treated. This design enables testing for importers’ behavioural responses: Did they shift towards exempt vehicles? Reduce imports of targeted vehicles? Or continue unchanged? Further, the analysis estimates green dividends (via shifts towards newer vehicles) and blue dividends (via changes in customs tax revenue) – a policy-relevant dual outcome, especially in light of Uganda’s heavy reliance on trade taxes (Tieu et al., Reference Tieu, Ayo and Jouste2023).
2.2. Data
We leverage a high-quality administrative dataset sourced from the Uganda Revenue Authority’s Automated System for Customs Data, which processes all vehicle imports at the border. The dataset spans 2013–2023 and includes vehicle-level import declarations, capturing valuation, origin, age, tax treatment and customs duty paid. This allows us to construct a consistent, high-frequency panel around the 2018 reform window, with sufficient granularity to identify vehicle type, treatment group and compliance behaviour. The data were accessed on-site at the URA research lab (URA, 2024), under secure conditions, and were cross-validated using official revenue performance reports and internal classification guidelines. As a full-universe customs dataset, it offers robust coverage and accuracy – making it ideally suited for policy evaluation using difference in differences.
2.3. Data cleaning and processing
To ensure analytical integrity, we implemented a rigorous data-cleaning protocol tailored to the demands of DiD estimation. We first eliminated duplicate entries and excluded records with missing values in key fields such as CIF value or customs duties. Implausible records were removed using empirically grounded thresholds: vehicles with CIF values below Uganda Shilling (UGX) 1,000,000 (likely clerical errors) or above UGX200 million (outliers inconsistent with Uganda’s import profile) (URA, 2024) were excluded. Export country names were standardised to ensure cross-year comparability, and we verified consistency in classification codes across the 2013–2023 panel window. These steps preserved both the internal validity of treatment-control comparisons and the temporal balance necessary for causal identification. The resulting dataset provides a clean, reliable basis for estimating both behavioural responses and fiscal outcomes of the reform.
3. Evaluation of Uganda’s 2018 carbon tax reform: Empirical strategy and results
This analysis evaluates the impact of Uganda’s 2018 vehicle tax reform on two policy objectives: (1) The ‘green dividend’, proxied by reductions in imports of older, high-emission vehicles and (2) The ‘blue dividend’, referring to fiscal gains from expanded customs revenue. The green dividend reflects the assumption – well-established in vehicle emissions literature – that newer vehicles emit fewer GHGs (Ayetor et al., Reference Ayetor, Mbonigaba, Ampofo and Sunnu2021). The blue dividend is particularly relevant in the LIC context, where domestic resource mobilisation is a pressing priority (Besley and Persson, Reference Besley and Persson2014; Okunogbe and Santoro, Reference Okunogbe and Santoro2023). To identify causal impacts, we apply a DiD design, exploiting variation in how the reform applied across vehicle categories. We compare tax revenues and import volumes between treated and control groups, before (FY2015/16–2018/19) and after (FY2019/20–2023/24) the reform. This quasi-experimental approach enables us to assess whether the reform delivered a double dividend – advancing both fiscal and environmental objectives.
3.1. Empirical strategy and data overview
This analysis evaluates Uganda’s 2018 vehicle decarbonisation tax reform using a quasi-experimental DiD approach to estimate its causal effects on two outcomes: (1) fiscal benefits (‘blue dividend’), measured by changes in customs revenue and (2) environmental benefits (‘green dividend’), proxied by shifts in the import volumes of high-emission (older) vehicles.
3.1.1. Identification strategy
We exploit policy-induced variation introduced by the reform, which changed environmental tax rates across specific vehicle categories based on age and type. The reform applied differentially to defined subgroups, creating a natural treatment–control structure. Treated units were vehicle categories directly affected by the reform (e.g., 6–8-year-old passenger vehicles newly exempted; or 9+ year-old vehicles facing higher levies), while control units were similar vehicle categories that were not directly impacted. To estimate causal effects, we compare pre- and post-reform trends in revenue and import volumes between these groups. The identifying assumption is the parallel trends condition – that in the absence of the reform, outcomes for treated and control groups would have evolved similarly. We assess this through event-study plots and placebo reform tests, detailed in Section 3.5.
3.1.2. Control group justification
Control groups were selected based on two principles: comparability in vehicle type and usage, and non-exposure to direct reform changes. For instance, when evaluating the expansion of the tax exemption for 6–8-year-old passenger vehicles, the control group includes vehicles aged 0–5 and 9+ years. This choice allows us to isolate the effect of the exemption, since all vehicles in this group are passenger vehicles with similar customs treatment, but only some were affected by the policy. In robustness checks, we apply narrower control group definitions – e.g., using only 0–3-year-old vehicles – to ensure our results are not driven by compositional differences across age groups. Results are consistent in sign and magnitude, lending confidence to the identification strategy (see Section 3.5.3).
3.1.3. Data sources and processing
The dataset draws on URA Customs microdata spanning FY2015/16 to FY2023/24, comprising individual vehicle-level import declarations. Each entry captures key attributes such as vehicle age, engine capacity, customs value (CIF), taxes paid and classification by type – either passenger or goods. Several data processing steps were undertaken to prepare the dataset for analysis. These included filtering the data to retain only used motor vehicles, while excluding motorcycles, trailers and non-road equipment. Vehicle ages were harmonised by computing the difference between the year of manufacture and the year of import, ensuring consistent classification across records. To address potential distortions from outliers – whether due to misreporting or luxury imports – CIF values were winsorised at the 1st and 99th percentiles. Binary treatment indicators were constructed for each DiD specification, distinguishing between affected and unaffected vehicle categories. Finally, records were aggregated to the vehicle-month level to smooth out volatility in daily import patterns.
The final cleaned dataset includes over 275,000 observations, with analysis conducted using time-fixed effects models to absorb national shocks across the reform period. This set-up enables a rigorous examination of whether Uganda’s reform delivered both the blue dividend (higher tax revenue) and the green dividend (reduction in imports of older, high-emission vehicles).
3.2. Descriptive patterns in vehicle imports and tax revenues
Before presenting the causal results, we examine aggregate trends in vehicle import volumes and customs revenue before and after the 2018 reform. These descriptive statistics provide initial context but should not be interpreted as causal effects, given their failure to account for compositional changes or confounders. As shown in Table 2 and Figure 1, the average annual tax revenue from used vehicle imports rose from UGX12.3 billion in the pre-reform period (FY2015/16–2018/19) to UGX13.7 billion in the post-reform period (FY2019/20–2023/24) – an increase of 11 per cent. Likewise, vehicle import volumes increased by approximately 7 per cent, from an average of 11,975 to 12,801 units per year.
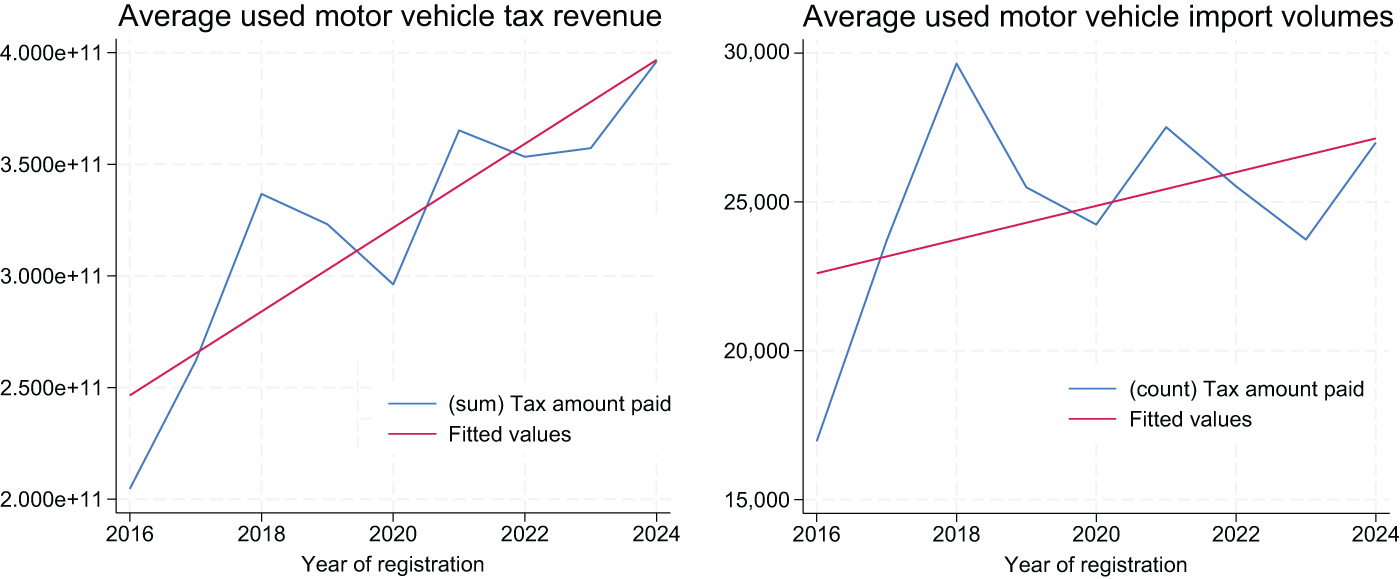
Figure 1. Naïve perspective on vehicle tax revenues and import volumes: 2015/16–2023/24.
Table 2. Naïve perspective on vehicle tax revenues and import volumes: 2015/16–2023/24
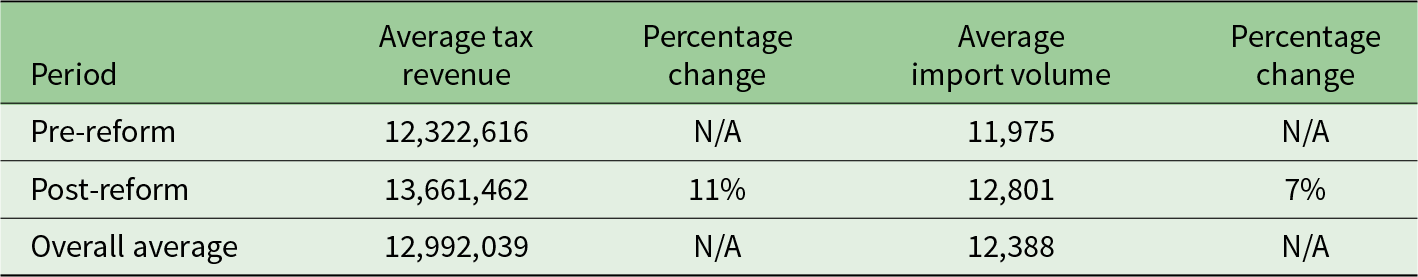
Source: Authors’ compilation based on URA (2024) Customs data.
While the upward shifts in both outcomes may suggest a potential ‘double dividend’, these patterns do not control for changes in vehicle composition, price effects, or broader macroeconomic factors. For instance, Uganda’s GDP grew at an average of over 5 per cent annually during this period (IMF, 2025), which could partly explain rising vehicle imports and customs collections. Therefore, we turn next to a set of component-specific DiD models to isolate the causal effects of each reform element and determine whether observed changes are attributable to policy rather than broader economic trends.
3.3. Component-level reform effects
Uganda’s 2018 vehicle tax reform was implemented through three distinct policy components, each targeting specific vehicle categories based on age and type. These components created quasi-experimental variation in tax liability, enabling a DiD evaluation of each reform’s causal effects on customs revenue (fiscal outcome) and import volumes (environmental outcome proxy). To estimate the impact of each component, we apply a standard fixed effects DiD model (as specified in Equation 1) of the following form:
 \begin{align}Outcom{e_{1t}} = & { }{\alpha _0} + {\alpha _1}Treatmen{t_i} + {\alpha _2}Pos{t_t} + {\alpha _3}\left( {Treatmen{t_i} \times Pos{t_t}} \right) \nonumber\\ & \quad\quad\quad\quad\quad\quad\quad\quad\quad\quad\qquad\qquad + {\alpha _4}log(CI{F_{it}}) + {\varepsilon _{it}}\end{align}
 where  ${\text{Outcom}}{{\text{e}}_{it}}$ estimates the impact of each component, we apply a common fixed-effects DiD model of the form $i$ at time $t$;
$t$;  ${\text{Treatmen}}{{\text{t}}_i}$ is a binary indicator equal to 1 for vehicle categories directly affected by the specific reform component; ${\text{Pos}}{{\text{t}}_t}$ is a binary indicator equal to 1 for observations in the post-reform period (FY2018/19–2023/24), and 0 otherwise; ${{\alpha }_3}$ is the coefficient that captures the causal effect of the exemption; ${\text{log}}({\text{CI}}{{\text{F}}_{it}})\,$controls for vehicle import value (cost, insurance and freight); and ${\varepsilon _{it}}$ is the error term. This model includes category-level fixed effects to control for time-invariant differences across vehicle groups, but not year fixed effects, allowing the ${\text{Pos}}{{\text{t}}_t}$ dummy to remain identifiable. This structure is held constant across all components, with only the definition of treatment and control groups varying accordingly.
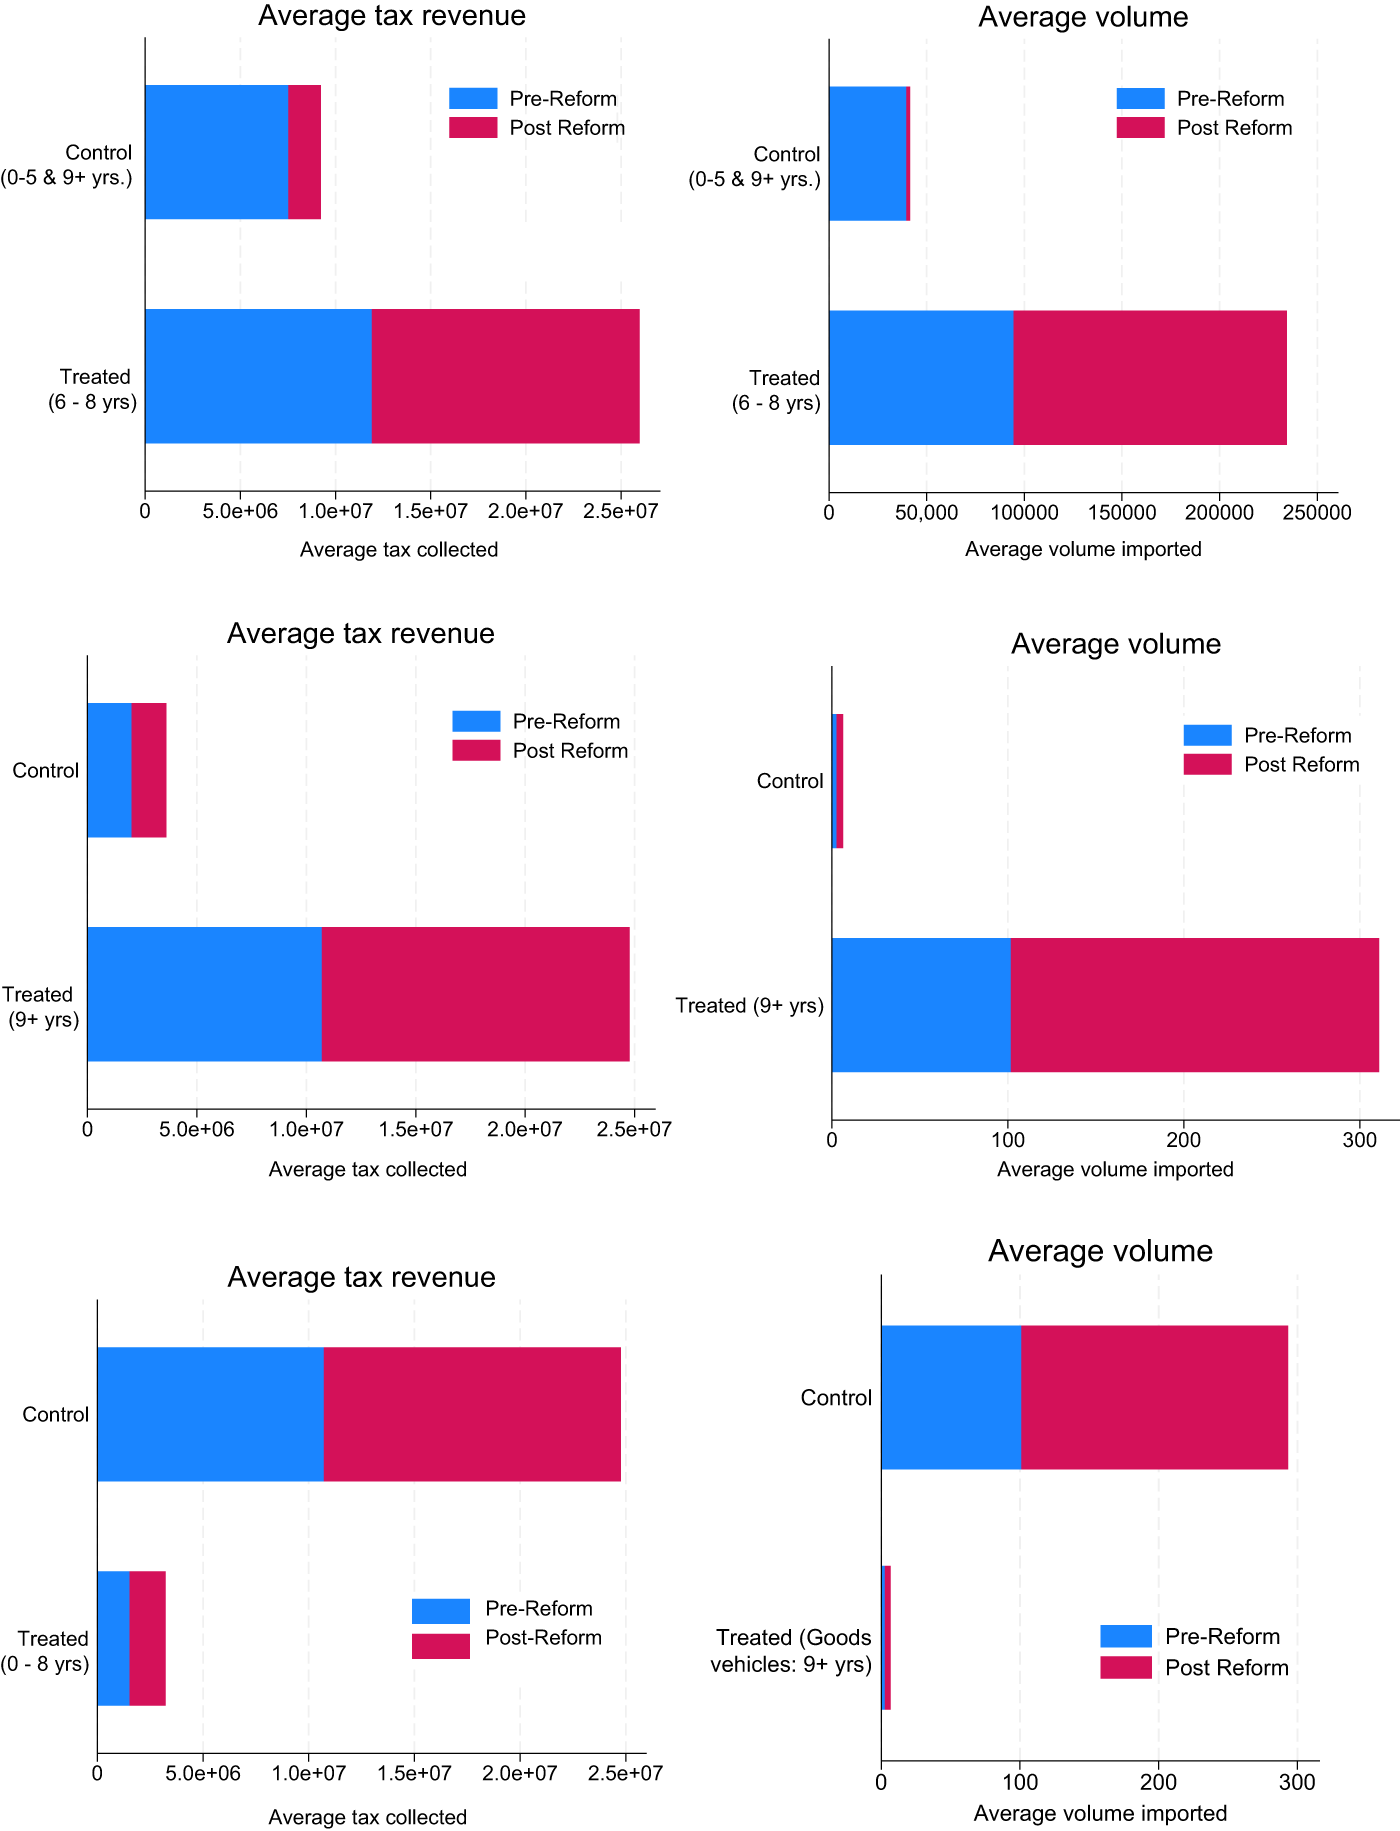
The control groups for each case were selected to ensure comparability in vehicle type, usage and customs classification, while remaining unaffected by the specific reform component. In Case 1, vehicles aged 0–5 and 9+ years formed the control group, maintaining pre-reform tax status. In Case 2, the control group consisted of passenger vehicles under 9 years, which faced no change in levy rates. In Case 3, the control group comprised goods vehicles under 9 years, which remained exempt from environmental taxation. These groupings were designed to isolate the effect of each policy with minimal contamination from concurrent reforms. Robustness checks using narrower comparison groups confirm the stability of the estimates (see Section 3.5.3). The robustness checks, including placebo tests and parallel trends diagnostics, are reported in Section 3.5. The descriptive and regression results for all three components are presented in Tables 3 and 4, respectively, and graphical summaries in Figure 2.

Figure 2. Summarised graphical perspective of post reform vs. pre-reform in Cases 1–3.
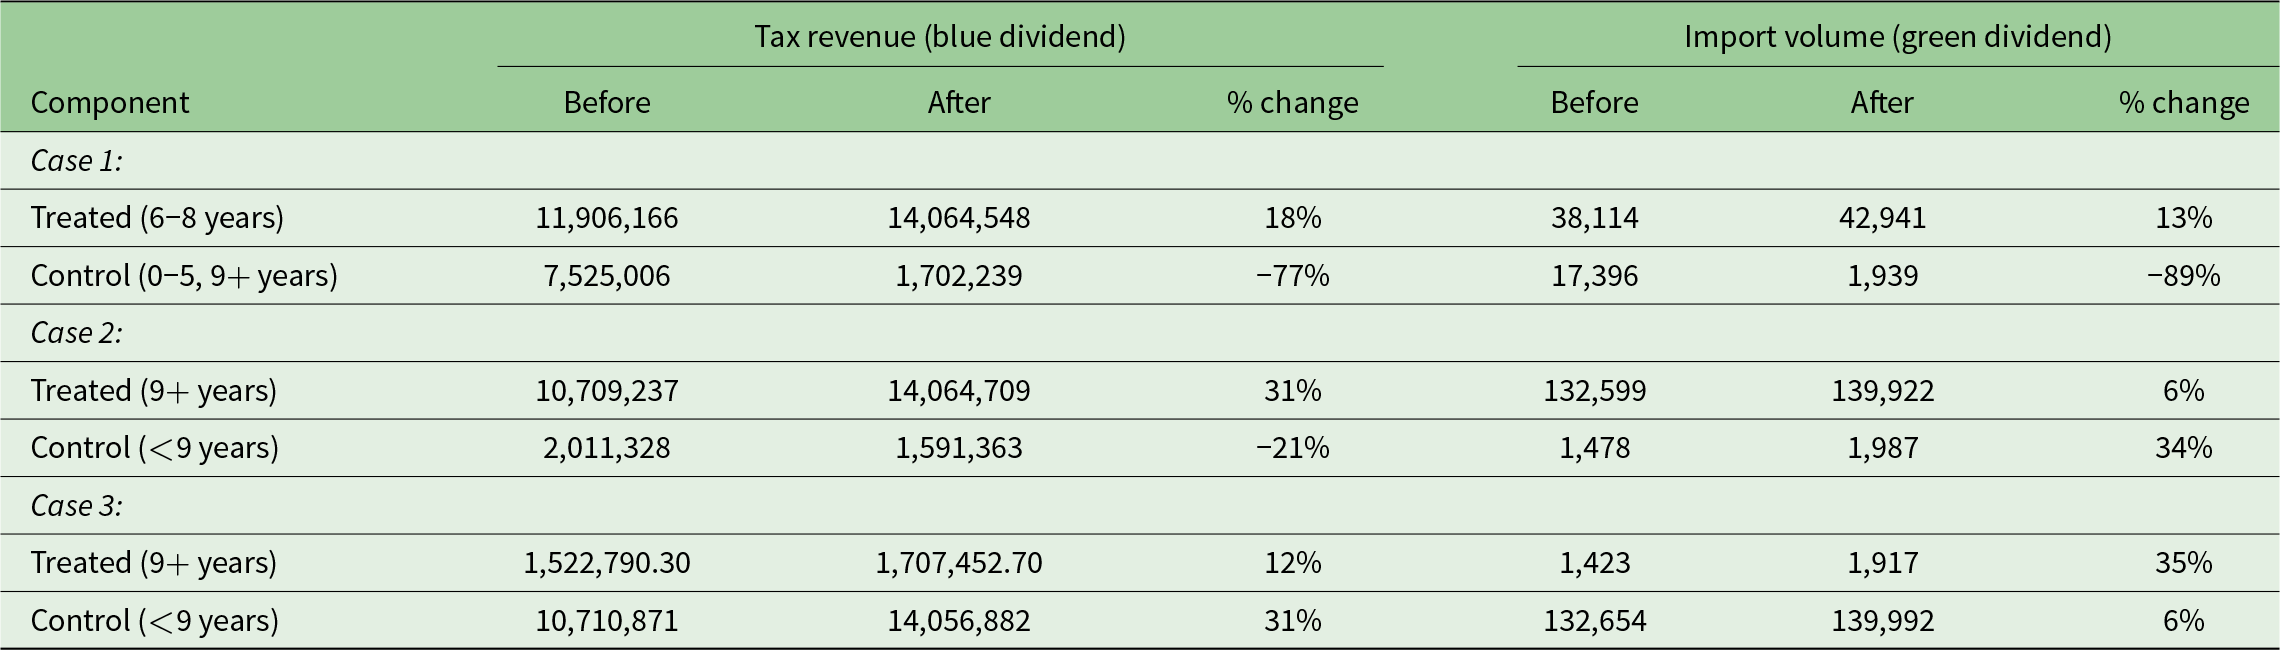
Table 3. Summary statistics by component

Notes: Case 1 = Increase in passenger-vehicle exemption age limit (from 0–5 to 0–8 years); Case 2 = Levy increase to 50% for passenger-vehicles aged 9+ years; Case 3 = 20% levy on goods-vehicles aged 9+ years.
Source: Authors’ compilation based on URA (2024) Customs data.
Table 4. Component-wise fixed effects DiD model results for tax revenue vs. Import volume
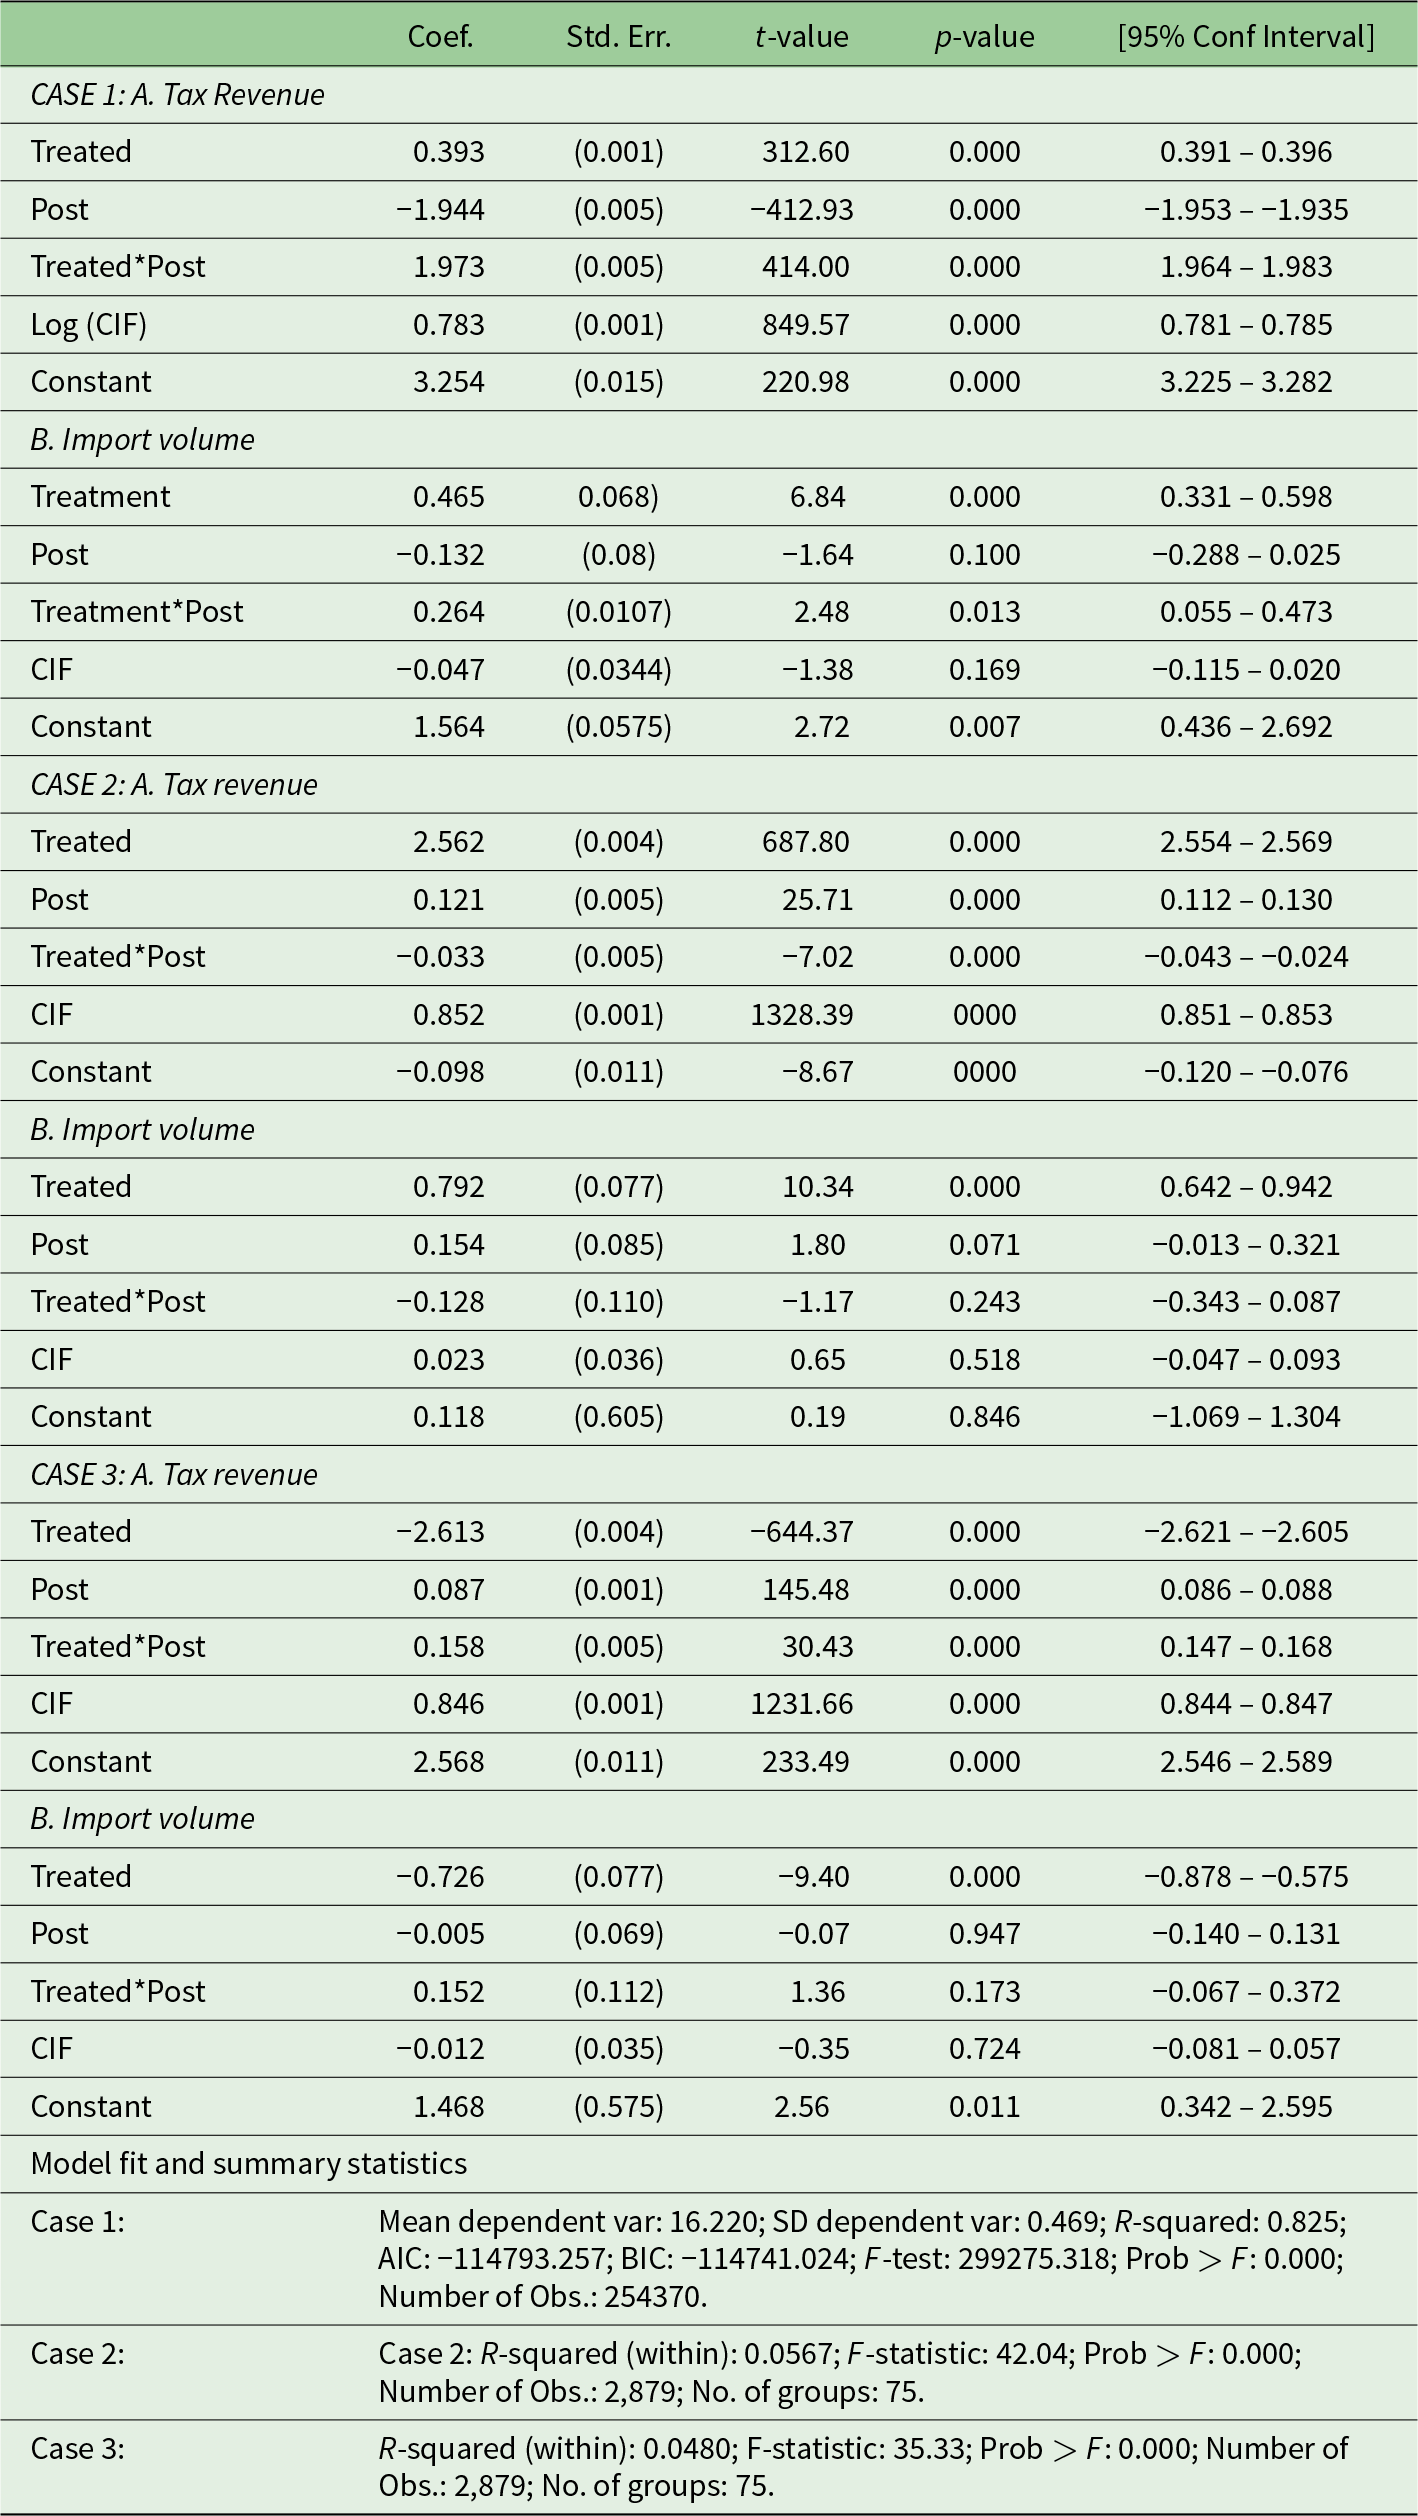
Source: Authors’ compilation based on URA (2024) Customs data.
3.3.1. Descriptive statistics and preliminary trends
Table 3 reports summary statistics across all three reform components, Cases 1–3. In Case 1, the expansion of the age-based exemption for passenger vehicles from 0–5 to 0–8 years led to an 18 per cent increase in average annual tax revenue and a 13 per cent increase in import volumes for the treated group (6–8-year vehicles). By contrast, the control group (0–5 and 9+ years) experienced sharp declines of 77 per cent in revenue and 89 per cent in volume, suggesting substantial substitution towards the newly exempt category.
In Case 2, the increase in the environmental levy from 35 per cent to 50 per cent for 9+ year passenger vehicles generated a 31 per cent increase in revenue and a modest 6 per cent rise in import volumes for the treated group. The control group (vehicles under 9 years) saw a 21 per cent decline in revenue but a 34 per cent increase in volume, indicating a shift in importer preferences that may reflect sensitivity to the tax differential. In Case 3, the introduction of a 20 per cent environmental levy on 9+ year goods vehicles resulted in a 12 per cent revenue increase and a 35 per cent rise in import volume for the treated group. However, control group revenues also rose substantially (31 per cent), and volumes increased by 6 per cent, pointing to sustained demand across both segments. Figure 2 presents the naïve visual summary of these pre- and post-reform shifts across all three cases. While these descriptive trends are suggestive, causal interpretation requires formal econometric estimation, which follows immediately after the naïve visual summary.
3.3.2. DiD regression results
Table 4 presents the DiD regression results for tax revenue and import volume, estimated separately for each reform component. Across all models, CIF value is included as a control, and time fixed effects are applied. The Treatment × Post interaction term captures the reform-induced effect on treated vehicle categories relative to their respective controls. In Case 1, the Treatment × Post coefficient is large and statistically significant for both tax revenue (1.973, p < 0.01) and import volume (0.264, p = 0.013). These findings confirm that the reform produced a double dividend: tax collections rose substantially despite the elimination of the environmental levy for 6–8-year vehicles, and import volumes increased, reflecting substitution towards newer, relatively cleaner vehicles. The increase in revenue suggests that higher volumes more than compensated for the reduced per-unit tax burden. The significant decline in control group volumes further supports the conclusion of behavioural substitution, particularly away from costlier 0–5-year vehicles.
In Case 2, the interaction term for tax revenue is negative and statistically significant (–0.033, p < 0.01), indicating a small decline in collections from 9+ year passenger vehicles following the levy increase. The volume effect (–0.128) is not statistically significant (p = 0.243), suggesting that the reform did not meaningfully reduce the importation of older vehicles. Although overall revenue increased – driven by growing imports of newer, higher-value vehicles in the control group – the policy delivered only a fiscal (blue) dividend, with limited environmental impact. This outcome highlights the limited price sensitivity among importers of older vehicles and suggests that complementary non-price instruments may be required to drive environmental outcomes. This insensitivity may stem from a strong preference for older vehicles over newer ones, as documented by Gorzelany (Reference Gorzelany2017) and Hemmings (2024).
In Case 3, the Treatment × Post effect is positive and significant for tax revenue (0.158, p < 0.01), indicating a 15.8 per cent gain in collections from older goods vehicles. However, the corresponding volume effect (0.152) is not statistically significant (p = 0.173), suggesting that the observed increase in imports may not be directly attributable to the policy. The results imply that the new levy mobilised additional revenue without substantially affecting import behaviour. As in Case 2, this pattern reflects a single (blue) dividend, with no robust environmental gains. The inelasticity of demand for older goods vehicles – driven by cost-effectiveness and functionality – appears to limit the policy’s ability to shift market choices.
Looked at collectively, the regression results underscore the uneven effectiveness of the three reform components. Case 1 stands out as a genuine double dividend, combining revenue gains with substitution towards relatively newer, less-polluting vehicles. The fiscal effect arose as rising volumes offset the per-unit tax reduction, while the exemption for 6–8-year vehicles redirected imports away from both costlier 0–5-year cars and higher-taxed 9+ year ones, generating meaningful – if partial – environmental benefits. Case 2 produced only a fiscal dividend: the levy increase reduced tax receipts from 9+ year passenger vehicles (–0.033, p < 0.01), but import volumes did not decline significantly (–0.128, p = 0.243), underlining the weak price elasticity of this segment and the limits of rate-based instruments in deterring polluting vehicle imports (Lonergan and Sawers, Reference Lonergan and Sawers2022). Case 3 yielded a similar single dividend: a significant revenue gain (0.158, p < 0.01) without a corresponding fall in imports (0.152, p = 0.173), reflecting the resilience of demand for older commercial vehicles given their affordability and indispensability for logistics. The strong CIF effect (0.846, p < 0.01) reinforces vehicle value as a central revenue driver. Taken together, these results show that while the reforms successfully mobilised fiscal resources, they fell short environmentally, illustrating the limitations of moderate tax instruments where functional utility and cost dominate purchasing decisions (Caulfield et al., Reference Caulfield, Farrell and McMahon2010).
3.4. Overall causal impact of the reform: Blue vs. Green dividend
Building on the component-level analysis above, we now estimate the overall average treatment effect of the 2018 vehicle decarbonisation tax reform. This allows us to assess whether the reform, taken as a whole, delivered the intended fiscal and environmental outcomes — the so-called ‘double dividend’. To estimate the average treatment effect across all components, we re-specify a fixed-effects DiD model adapted from the general structure presented above. Here, the  $Treatmen{t_i}$ variable is redefined to capture vehicle groups affected by any reform action, allowing us to estimate the aggregate fiscal and environmental outcomes. Accordingly, we estimate the following fixed-effects DiD models (as specified in Equations 2 and 3):
 \begin{align}Tax\_Revenu{e_{it}} = & \,{\gamma _0} + {\gamma _1}Treatmen{t_i} + {\gamma _2}*Pos{t_t} + {\gamma _3}\left( {Treatmen{t_i}*Pos{t_t}} \right) \nonumber \\ & \quad\quad\quad\quad\quad\quad\quad\quad\quad\quad\qquad\qquad\quad + {\gamma _4}{\text{log}}({\text{CI}}{{\text{F}}_{{\text{it}}}}) + {e_{it}}\end{align}
 \begin{align}ImportVo{l_{it}} = & { }{\varphi _0} + {\varphi _1}Treatmen{t_{1i}} + {\varphi _2}*Pos{t_t} + {\varphi _3}\left( {Treatmen{t_i}*Pos{t_t}} \right) \nonumber \\& \quad\quad\quad\quad\quad\quad\quad\quad\quad\quad\qquad\qquad\quad + {\varphi _4}{\text{log}}({\text{CI}}{{\text{F}}_{{\text{it}}}}) + {\varepsilon _{it}}\end{align}
 where  ${\text{Tax\_Revenu}}{{\text{e}}_{it}}$ is the log of tax revenue for vehicle category $i$ at time $t;$
$t;$  ${\text{ImportVo}}{{\text{l}}_{it}}$ is the log of import volume for vehicle category $i$ at time $t;\,Treatmen{t_i}$ equals 1 for vehicle categories directly affected by any component of the reform; ${\text{Pos}}{{\text{t}}_i}$ equals 1 for all observations in the post-reform period; $Treatmen{t_i}*Pos{t_t}\,$is the interaction term capturing the average treatment effect of the reform; ${\text{log}}({\text{CI}}{{\text{F}}_{it}})\,$controls for import value (cost, insurance and freight); while ${e_{it,{ }}}{\varepsilon _{it}}$ is the model’s error term. As before, we include fixed effects for vehicle category $i$ only, which allows ${\text{Pos}}{{\text{t}}_i}$ dummy. The regression results are shown in Table 5.
Table 5. Overall fixed effects DiD model results for the reform: blue vs. Green dividenda
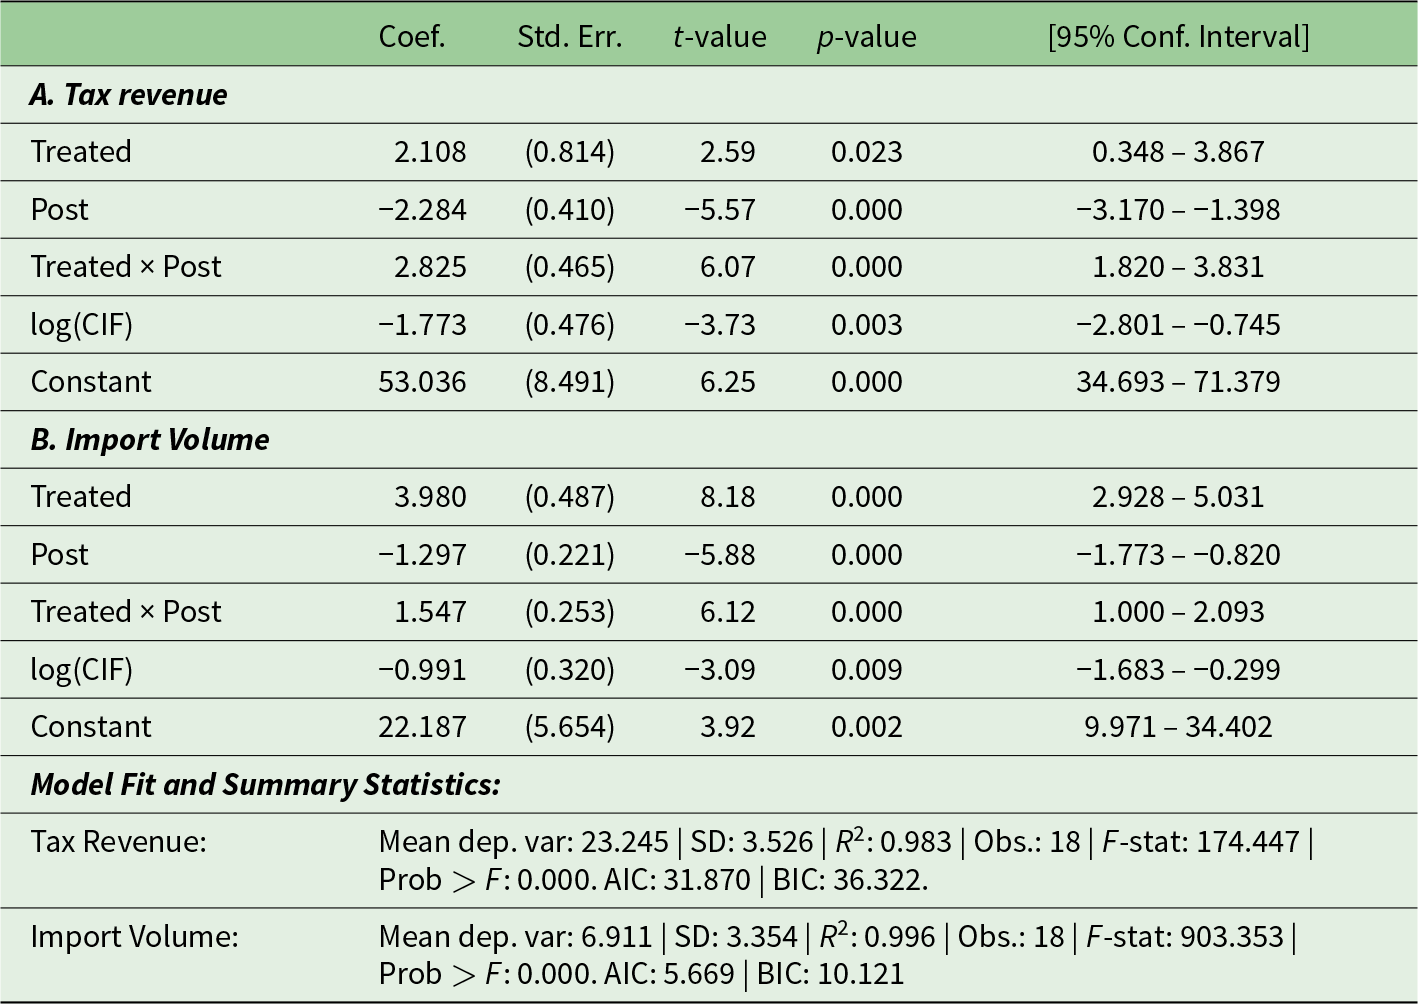
Notes: Fixed effects included for category i only.
a Robustness checks, including a placebo test, event study analysis and alternative control group specifications, are reported in Section 3.5. These tests support the validity of the identification strategy and confirm the stability of the estimated treatment effects.
Source: Authors’ compilation based on URA (2024) Customs data.
The overall DiD estimates confirm that the 2018 reform generated substantial fiscal gains while partially advancing environmental objectives. On the fiscal front (blue dividend), the coefficient on the treated group (2.108, p < 0.05) suggests that tax revenues were already higher for vehicles affected by the reform even prior to its implementation, while the negative post-reform effect for the control group (–2.284, p < 0.01) reflects a decline in tax revenue from unaffected vehicle types – likely due to stagnant or falling import volumes. Crucially, the significant positive interaction term (2.825, p < 0.01) reveals a 282.5 per cent increase in tax revenue among the treated group post-reform, underscoring the reform's success in broadening the fiscal base. Although the CIF coefficient is negative (–1.773, p < 0.01), this likely reflects the behaviour of price-sensitive consumers in LICs, who may opt to retain older vehicles or purchase domestically resold ones when faced with higher CIF-linked import costs – decisions that reduce external tax collections. On the environmental front (green dividend), the import volume model shows that the treated group had significantly higher pre-reform import levels (3.98, p < 0.01), while the control group experienced a sharp decline post-reform (–1.297, p < 0.01), suggesting a broader shift in import patterns. The positive interaction term (1.547, p < 0.01) confirms a 154.7 per cent post-reform increase in import volumes for vehicles directly targeted by the reform, consistent with substitution towards cleaner vehicles, though older models remained in demand. Both models exhibit high explanatory power, with R 2 values of 0.983 and 0.996 for tax revenue and import volumes, respectively – indicating that the core reform effects are robust and strongly predictive of the observed trends.
Taken together, the aggregated results confirm that the 2018 reform delivered a clear blue dividend, significantly expanding the tax base through increased revenue from targeted vehicle categories. The green dividend, while directionally consistent with the reform’s environmental goals, is more limited in its strength and statistical robustness. Import patterns shifted towards relatively newer, lower-emission vehicles – particularly passenger vehicles – but the continued importation of older goods vehicles suggests that price-based tax instruments alone may be insufficient to induce substantial emissions reductions. Thus, while the reform achieved a partial double dividend at the aggregate level, its environmental gains were uneven across vehicle types. Complementary measures – such as binding age limits, emissions testing, or targeted incentives for low-emission imports – may be required to reinforce environmental outcomes and ensure greater alignment between fiscal and climate objectives in LIC contexts.
3.5. Robustness and sensitivity checks
To reinforce confidence in our identification strategy, we conducted three robustness checks in line with best-practice quasi-experimental evaluation (Bertrand et al., Reference Bertrand, Duflo and Mullainathan2004; Wing et al., Reference Wing, Simon and Bello-Gomez2018): a ‘parallel trends’ check via event studies, a falsified reform-year placebo test, and sensitivity tests using alternative control groups.
3.5.1. Testing the parallel trends assumption
We estimate an event study model using time indicators centred on the 2018 reform and interacted with treatment status. Online appendix figures A1–A3 show pre-reform trends in tax revenue and import volumes across the three case studies. From 2016 to 2017, treated and control groups display similar trends, supporting the parallel trends assumption. Minor upticks in late 2017 may reflect policy anticipation during stakeholder consultations (see Section 2). After 2018, trends diverge sharply, indicating strong treatment effects from the reform.
3.5.2. Placebo test (fake reform year: 2016)
To test for spurious pre-trends, we re-estimate the model using a fake reform year (2016). The interaction term is small and statistically insignificant (coef. = 0.129, p = 0.002), indicating no systematic pre-reform divergence. This null result strengthens causal attribution to the actual 2018 reform. Full results are reported in appendix table A1.
3.5.3. Alternative control group (0–3 vs. 6–8 years)
We test sensitivity to control group selection by comparing vehicles aged 6–8 years (treated) to a narrower control group of newer vehicles (0–3 years). The interaction coefficient remains positive and consistent in magnitude (coef. = 0.396, p = 0.285), though statistically insignificant. This robustness check confirms the stability of our main estimates. See appendix table A2 for full results.
3.5.4. Implications for main findings
These robustness checks reinforce the credibility of our findings. The placebo test rules out confounding pre-trends; the event study supports parallel trends and reveals dynamic post-reform effects; and the alternative control group analysis confirms estimate stability. Collectively, these strengthen the interpretation that Uganda’s 2018 carbon tax reform produced significant fiscal gains and behavioural adjustments, particularly by discouraging imports of older, more polluting vehicles.
3.6. Limitations and alternative explanations
While our robustness checks – placebo tests, event studies, and alternative control specifications – enhance causal credibility, several limitations remain. First, though fixed effects control for unobserved time-invariant factors, residual time-varying shocks (e.g., macroeconomic fluctuations or concurrent policy shifts) may still correlate with treatment (Angrist and Pischke, Reference Angrist and Pischke2009). Second, high public visibility of the reform may have triggered anticipatory behaviour, subtly biasing pre-trends. Third, despite careful control group selection based on vehicle age and emission profiles, unobserved influences like resale prospects or regional demand differences may have affected import patterns. Lastly, while CIF values proxy for vehicle quality and valuation, omitted factors – such as enforcement intensity or port-level practices – may affect revenue outcomes (Wing et al., Reference Wing, Simon and Bello-Gomez2018). However, these caveats do not overturn our findings but highlight the challenges of policy evaluation in real-world settings.
3.7. Policy implications for Uganda and comparable low-income countries
Our findings offer relevant insights for LICs pursuing both revenue generation and environmental goals. While environmental taxation remains underutilised across Sub-Saharan Africa (Occhiali, Reference Occhiali2024), Uganda’s 2018 vehicle tax reform demonstrates that well-calibrated instruments can yield fiscal gains alongside modest environmental improvements. This section distils key lessons for broader policy application, drawing on both the empirical evidence from Uganda and comparative experiences from other LICs.
3.7.1. Practical lessons and empirical insights for policy transfer
Uganda’s reform expanded its tax base while delivering environmental gains. Our estimates (Table 5) show significant increases in tax revenue and import volume, supporting a dual fiscal-environmental benefit. This ‘tax base double dividend’ is especially relevant for LICs with constrained fiscal capacity. Comparable outcomes in Ghana and Mauritius (Kombat and Wätzold, Reference Kombat and Wätzold2019; Ambareen, Reference Ambareen2023) affirm the potential of targeting consumption externalities through low-burden instruments. One important lesson lies in the design of targeted and administratively simple instruments. Uganda’s import-based environmental levy is relatively easy to implement using existing customs procedures. Such instruments suit LICs where enforcement capacity for direct emissions monitoring remains weak.
Also critical is the tailoring of tax design to behavioural elasticities. Category-specific estimates (Table 4) show, for instance, a 15.8 per cent revenue increase for older goods vehicles, but no statistically significant change in volume – suggesting that price sensitivity varies across vehicle types (Guo et al., Reference Guo, Kelly and Clinch2022). Poorly calibrated reforms can risk regressivity or invite evasion (Timilsina and Sebsibie, Reference Timilsina and Sebsibie2023), especially in informal markets. Differentiated tax schedules can reduce such distortions.
The reform also highlights the importance of complementary measures. In Case 2, where a 15-percentage point tax increase for older passenger vehicles yielded a non-significant 12.8 per cent decline in imports, it appears that price signals alone may be insufficient. Emissions testing, phase-out regulations, or subsidies for cleaner vehicles may be needed to reinforce the environmental objective.
Finally, Uganda’s experience highlights the importance of reform sequencing and stakeholder engagement. Public consultations, clear timelines, and data-driven messaging likely contributed to smoother implementation and early behavioural shifts. Evidence from the earlier 2015 levy reform reinforces this point: Forster and Nakyambadde (Reference Forster and Nakyambadde2020) show that while the tariff reduced imports of older vehicles, its short-run impact was dampened by trader stockpiles and substitution towards even older models. These dynamics underscore the need for complementary domestic regulation – such as stricter resale controls or vehicle registration policies – to avoid leakage and reinforce reform intent. As shown in Rwanda’s phased e-mobility rollout (Bajpai and Bower, Reference Bajpai and Bower2020) and Chile’s integrated energy reforms (Veliz et al., Reference Veliz, Walters, Fica and Busco2025), coordinated, well-sequenced implementation enhances both policy durability and public acceptance.
3.7.2. Strategic considerations and risk factors
Despite Uganda’s relative success, environmental tax reform in LICs must be approached with a clear understanding of strategic risks and implementation constraints. One important consideration is policy anticipation: where reforms are publicly signalled, importers may accelerate or delay transactions to minimise tax burdens. As demonstrated by a similar reform in 2015, importers in Uganda responded to the levy increase by drawing down inventory and shifting demand towards even older vehicles, temporarily offsetting intended environmental benefits (Forster and Nakyambadde, Reference Forster and Nakyambadde2020). Such responses can distort pre-reform baselines and complicate causal attribution in impact evaluations.
Strategic behaviour and compliance evasion are significant risks in weak enforcement environments. In response to higher levies, importers may underreport vehicle age, reclassify high-emission vehicles (e.g., as commercial), or reroute through under-monitored land borders (Chalendard et al., Reference Chalendard, Fernandes, Raballand and Rijkers2023). These tactics exploit gaps in customs systems, including paper-based processes, limited vehicle databases and weak inter-agency coordination. In Uganda, such practices have historically diluted the impact of import restrictions. Without robust digital verification and risk-based audits, these evasive responses can substantially erode both fiscal gains and environmental outcomes.
On the political economy front, carbon-related taxes often face opposition where they are perceived as regressive or poorly targeted. This risk is particularly pronounced in LICs where public trust in government spending is low, and where transport or fuel costs are politically sensitive (Köppl and Schratzenstaller, Reference Köppl and Schratzenstaller2023). Framing reforms as tools for development – e.g., linking revenue to visible public investments or environmental improvements — can help build public acceptance.
Finally, institutional mismatch poses a major threat to reform effectiveness. Misalignment between tax authorities, environmental regulators and transport agencies can lead to gaps in enforcement or contradictory incentives. For example, Uganda’s earlier vehicle decarbonisation reforms were undermined in part by the absence of supporting policies to regulate domestic resale or promote scrappage, leading to extended life cycles for high-emission vehicles already in circulation (Forster and Nakyambadde, Reference Forster and Nakyambadde2020).
For these reasons, replicating Uganda’s success will require more than sound policy design. It also demands institutional readiness, credible enforcement, inter-agency coordination and a political communication strategy that frames environmental taxation as a tool for both fiscal resilience and ecological stewardship.
4. Summary and conclusion
This paper introduces a new conceptual variant of the double dividend hypothesis: the tax base double dividend, in which environmental tax reform expands revenue capacity without raising statutory rates – an especially relevant outcome for LICs with shallow tax bases. This variant complements the established employment and welfare dividends, offering a tailored fiscal-environmental win for structurally constrained settings. Using Uganda’s 2018 vehicle decarbonisation tax reform as a natural experiment, the study shows that environmental taxes can yield meaningful dual gains even in low-capacity settings.
The reform produced heterogeneous outcomes across its components. In Case 1, extending the tax-exemption window led to a 26.4 per cent increase in newer vehicle imports and a substantial rise in tax revenue – even at a 0 per cent tax rate – demonstrating a full double dividend. Case 2, which increased the levy to 50 per cent on older passenger vehicles, resulted in a net 9 per cent revenue gain but no significant behavioural change – yielding only the blue dividend. In Case 3, introducing a 20 per cent tax on previously exempt goods vehicles raised revenue by 15.8 per cent, again without a significant environmental shift. These variations affirm the importance of contextual factors in shaping carbon tax outcomes, consistent with Oueslati’s (Reference Oueslati2014) argument. In aggregate, however, the reform generated a 282.5 per cent increase in revenue and 154.7 per cent growth in newer vehicle imports, producing a net 25 per cent environmental gain. While modest, this shift validates the feasibility of well-calibrated carbon taxes in LICs.
The Uganda case offers several practical lessons. Success depended not just on design, but on sequencing, stakeholder engagement and data-driven policy framing. Strategic non-compliance – through underreporting or reclassification – remains a risk where enforcement is weak, underscoring the value of digital customs systems and inter-agency coordination. Cross-country transferability is plausible if adapted to local conditions. LICs may benefit from simple, import-based instruments as policy entry points, especially where administrative capacity is limited. Lessons from Rwanda’s phased e-mobility rollout and Chile’s integrated energy-greening reforms highlight the importance of flexible, institutionally aligned implementation.
While aligning with elements of previous literature, this study breaks new ground by introducing and empirically testing the tax base double dividend in an LIC context. Uganda’s experience illustrates that environmental tax reform can serve dual goals – revenue mobilisation and decarbonisation – even in challenging institutional environments, provided that reforms are tailored, enforced and sequenced effectively.
Supplementary material
The supplementary material for this article can be found at https://doi.org/10.1017/S1355770X25100326.
Acknowledgements
We thank Judith Kembabazi, Customs Supervisor in the Risk Management Division, URA, for her support with research data.
Competing interests
The authors declare none.


 Open access