


Introduction
Censuses have long been a central theme in the cultural history and the historical anthropology of what Michel Foucault labeled “governmentality.” Luke’s account of Jesus’s birth famously opens with a census, but it was especially during the nineteenth century that growing state bureaucracies came to associate census taxonomies and population classification with modern governance. In settings as different as the Habsburg Empire (Göderle Reference Göderle2016), British India (Cohn Reference Cohn1987: 224–54), colonial Southeast Asia (Anderson Reference Anderson1993: 163–85), and Latin America (Loveman Reference Loveman2014: 79–206), censuses formalized and politicized group identities. Such histories of census taking have taught us much about the state and elite rationales. With good reason, historians have learned to meet censuses and their motivations with a healthy dose of skepticism.
This justified wariness, however, has not translated into much detailed historical analysis of census-taking practices. Once a respectable subfield of US demographic history (Chandra Sekar and Deming Reference Chandra Sekar and Edwards Deming1949; Ginsberg Reference Ginsberg1988; Sharpless and Shortridge Reference Sharpless and Shortridge1975; Steckel Reference Steckel1991), historical inquiries into the nitty-gritty of enumeration have become rare, with few recent exceptions (Bouk Reference Bouk2022). They have long been almost nonexistent for historical settings other than the US Notwithstanding ongoing source digitization and new digital methods, the gap between generalized census skepticism and the all too often unbothered use of censuses by social science historians remains undiminished. To demonstrate mixed-method ways to bridge this gap is the main purpose of this article.
In order to do so, the article draws on the example of racial statistics in nineteenth-century Buenos Aires. It thereby relates to historiographic discussions about the census-reported decline of Buenos Aires’s Afro-descendant population during the nineteenth century: from 14,928 morenos and pardos according to the census of 1838, or 26 percent of the city’s racially classified population, to only 8,005 people of “colors” other than white, a mere 1.8 percent of the total, in 1887 (Andrews Reference Andrews1980: 66). Specifically, the article challenges the widely held belief among scholars that this reported decline was merely the result of an “ideological manoeuvre” (Karush Reference Karush2012: 215) or of “falsified statistics” (Schávelzon Reference Schávelzon2003: 179). The notion that the reported decline stemmed largely from “the statistical transference of a large segment of the Afro-Argentine population from the black racial category to the white” was first formulated in a classic book by Andrews (Reference Andrews1980: 89). Its frequent reiteration since – with some ancillary datapoints in scholarship (Alberto Reference Alberto2022: 88; Edwards Reference Edwards2020: 42–6 and 115–7; Geler Reference Geler2010: 67) as well as mass media (Goñi Reference Goñi2021; Edwards Reference Edwards2022) – aligns with the political aim “to disarm customary narratives about the supposed disappearance of [Argentina’s] Black population, in order to show, in turn, that it has always been and continues to be there” (Adamovsky Reference Adamovsky2023). But this worthwhile goal should not blind us to a detailed scrutiny of the available demographic records. Their in-depth examination in this article testifies to structural racism and adverse living conditions of Buenos Aires’s population of African descent during the nineteenth century, which underpinned the reported decline.
Perhaps because of the sensitivity of the underlying politics, scholarly and public debates about this purported demographic decline suffer from terminological imprecisions that require early clarification. Whereas the debate has long revolved around an alleged “disappearance” of Argentina’s Black population, which censuses never corroborated to begin with, this article instead discusses the plausibility of demographic decline. Unlike much of the broader debate, which often barely differentiates between relative and absolute demographic decline, the article concentrates on absolute numbers of people classified with categories denoting African ancestry. Admittedly, it was chiefly the dramatic relative decline (from 26 percent in the late 1830s to 1.8 percent in the late 1880s, according to the censuses) that drove the societal “invisibility” of Afro-descendants on which scholars have recently commented (Alberto Reference Alberto2022: 12–3 and 35–6). This relative decline, in turn, was overwhelmingly driven by European immigration: The city’s European-born population (thus excluding their many Argentine-born children) grew from 26,424 in the 1855 census (28.9 percent of the total) to 79,027 in 1869 (44.5 percent) (Primer Censo 1872: 38–39) and 320,957 in 1895 (48.3 percent) (Segundo Censo 1898, vol. 2: 15). This massive demographic change doubtless impacted Buenos Aires’s nonwhite population in multiple ways, but it is a separate topic from this article’s focus on the census-reported absolute demographic decline of the Afro-descendant population.
Any test of the plausibility of this reported decline will have to grapple with changing racial schemas and labels. Most censuses of Buenos Aires until 1854 contained a question about “color,” to which enumerators responded with a variety of terms. As is customary in the historiography (Andrews Reference Andrews1980; Alberto Reference Alberto2022), this article treats four census labels as Black or Afro-descendant: moreno (literally brown), which denoted full African ancestry and gradually replaced negro, which also referred to full African ancestry, but was increasingly viewed as impolite; and pardo, which designated mixed African and European descent and, in a similar transition, supplanted the more colonial term mulato. Other common labels, such as blanco (white), the various terms designating indigenous ancestry (chino, indio, and mestizo), and the peculiar term trigueño (wheat-colored), are treated separately.
These labels were applied in inconsistent and changing ways. From the 1850s onwards, Argentine censuses increasingly abandoned racial classification, earlier than those of other Latin American countries (Loveman Reference Loveman2014: 79–206). The municipal census of 1887 was the century’s last to ask about “color,” and for that reason constitutes a crucial anchor point in the discussion. But it unfortunately has no surviving manuscript schedules, so that historians have to rely on its published tabulations. Whereas a “color” question forced census takers to fill in some label on their preprinted forms, other demographic records, such as parish books of baptisms and burials, compelled no such racialization. Elite desires to silence the existence of nonwhite minorities, statisticians’ mistrust of classificatory practices, elites’ increasing disavowal of colonial legacies, and the perception that the question was irrelevant in law and governance (Otero Reference Otero2006: 341–67) all combined to erode the use of racial labels in many records. The tangled maze of motives undergirding this gradual, but uneven, decline in the use of racial labels complicates the analysis.
Whereas public and scholarly debates often dwell on racial classification, nineteenth-century statisticians worried more about coverage – that is, the question of who was counted and omitted. This additional layer of complication produces the main challenge for today’s analyst, which is to evaluate the interrelationship between census coverage and content (or classification). Whichever way we look at the problem, the argument that the drop from 14,928 morenos and pardos reported in 1838 to 8,005 people of “colors” other than white in 1887 did not reflect real demographic decline requires us to believe that people who in 1838 were recorded as Afro-descendants no longer were enumerated as “colored,” or not counted at all, in 1887. If the reported decline was a mirage of enumeration, then coverage or classification, or a combination thereof, must increasingly have undercounted the city’s inhabitants of African descent.
The core problem lies in the relationship between coverage and classification. Even if we accept Andrews’s hypothesis of a “statistical transference … from the black racial category to the white,” (Andrews Reference Andrews1980: 89) as most scholars today do, it only explains the overall drop if we simultaneously rule out significant improvements in coverage. If “transference,” or reclassification, were the key explanation, we should also not find evidence of demographic decline in other, separately collected, records. Specifically, parish books should not indicate an excess of burials over baptisms classified with labels denoting African ancestry. While it is important to recognize that these different demographic records raise discrete sets of issues, we must also acknowledge their interdependence. Disputing or corroborating the accuracy of one piece or genre of demographic information usually requires faith in another.
Testing the hypothesis of a Black undercount consequently demands interrelating different kinds of sources: thousands of manuscript schedules (sometimes called sheets or returns) from censuses until 1855, in particular a manually collected sample of 5,000 inhabitants from 1854, a complete database of all 79,825 individuals in the surviving schedules of 1855, and a more limited number of schedules and tabulations of other censuses.Footnote 1 These are complemented by cadastral surveys and maps, tax lists, and especially baptismal and burial books from the city’s various parishes between the 1830s and 1860s. The article interrogates them along three lines of inquiry: census (under-) coverage prior to 1860; racial classification in the course of the century; and vital statistics, which before the rollout of civil registration in 1884 derived from parishes’ baptismal and burial records.
Do these three domains combine in such a way as to suggest a progressive Black undercount? For if the reported demographic decline of Buenos Aires’s African-descended population were primarily a mirage of recording practices, as much of the scholarship claims, we would have to argue that Afro-descendants were increasingly undercounted for one reason or another. Herein lies the rub, as well as this article’s central argument: Arguing that the census-reported decline of the city’s Afro-descendant population stemmed chiefly from “statistical transference,” an “ideological manoeuvre,” or “falsified statistics” requires us simultaneously to stand by several assumptions that are difficult to reconcile with each other. Realizing this should help restore some critical confidence in the available demographic sources, which indicate that dire living conditions indeed drove a significant absolute decline of Buenos Aires’s Afro-descendant population during the nineteenth century.
Coverage
Though rarely raised with specific regard to race in nineteenth-century Argentina, the first question commonly asked about historical censuses concerns coverage: Did they miss a large number of people and did they miss some people more than others (differential under-coverage)? The question alone casts doubt on the hypothesis of an exacerbating undercount between 1838 and 1887 insofar as, by default, overall coverage must be assumed to have improved during that period. Prior to the fall of the government of Juan Manuel de Rosas in 1852, the city and province of Buenos Aires suffered from a precarious and fitful bureaucracy regarding topographic surveying, taxation, and statistics. But from the 1850s onward, statisticians, as much as later demographic historians, agreed that census quality improved, with the count of 1855 widely seen as reasonably reliable, or the moment when Buenos Aires entered the “statistical age” (Massé Reference Massé, Celton, Ghirardi and Carbonetti2009). If overall coverage did improve, the census-reported absolute decline of the Afro-descendant population between 1838 and 1887 can only be attributed to a coverage problem if differential under-coverage increased so markedly as to outweigh overall improvements.
In general, historians have been more distrustful of the century’s earlier censuses. Barring the botched attempt of 1854, the census of 1810 (the year of Argentina’s independence) has been impugned most seriously with regard to its coverage. Nineteenth-century statisticians as well as later historians have evaluated overall census performance either by looking at the general progression of results against the backdrop of assumptions about vital statistics and migration, or by juxtaposing census totals with baptisms, to see if the population counted in a census could plausibly have produced the number of baptisms recorded in parish books. The inexistence of officially published tabulations prior to the 1850s added a layer of difficulty to these methods. The frequent scenario of missing schedules turned census totals into mere, and hence debatable, estimations of a final figure that would have emerged from the complete number of schedules.
While the overall progression from 1810 to 1869 (see Table 1) is roughly plausible, common estimates of the 1810 census in the 41–45,000 range have long seemed suspiciously low, as they would have had difficulties in producing the previous years’ totals of baptisms reported in parish books (Martínez Reference Martínez1889: 238–42; Johnson Reference Johnson1979: 115). Estimating overall under-coverage with this method depends on what plausibility range we assume for the crude birth rate (CBR: live births per 1,000 population). Though Johnson (Reference Johnson1979: 115) defines 50 as the highest plausible ceiling of Buenos Aires’s CBR in 1810, taking into account the city’s young population at that time, demographic historians unworriedly indicate a CBR of 58 in 1810 (Lattes et al. Reference Lattes, Andrada and Caviezel2010: 135); remarkably high, though by no means outlandish in light of white CBR estimates for the North American Midwest, which in Indiana, Illinois, and Michigan exceeded 60 in 1800–20 (Schapiro Reference Schapiro1982: 594–5).
Table 1. Reported and estimated census results by race in nineteenth-century Buenos Aires
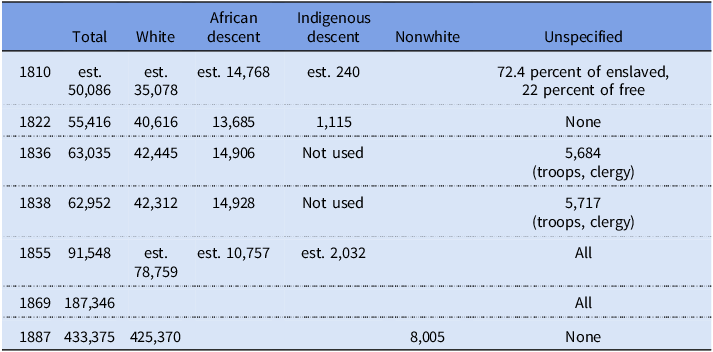
The other problem affecting this method of gauging coverage is whether baptisms actually matched births. A closer look at the city’s early nineteenth-century church books reveals a significant number of baptisms of enslaved adults, which dovetailed with the peak of the slave trade to the Río de la Plata in the final years of the Spanish colony and which obviously cannot be computed as births: 19.8 percent of all baptisms “of color” (de color) in the central Merced parish in 1809 and 1810, according to a manual recount.Footnote 2 Relying on census indications that around one quarter of the city’s population was of African descent at that point (Table 1), around 5 percent of baptisms would have to be subtracted to arrive at births. Projecting a CBR of 58, we land on a population estimate of 50,086 for 1810. This would mean that the 1810 census omitted 13–22 percent of the real population, or more if the real CBR was lower, as assumed by Johnson (Reference Johnson1979: 115); or less if there were more missing schedules that earlier statisticians had never heard about.
Though difficult to quantify, overall coverage problems no doubt persisted into the 1850s, but likely diminished thereafter. The counts of 1822, 1827, 1836, 1838, and 1855 all withstand scrutiny through holding baptisms against census totals. Yielding believable CBRs, all below 50, they also make for a plausible progression (Martínez Reference Martínez1889: 242–52). The outlier of 1854, producing a total of only 71,438 (Registro 1857, vol. 1: 15),Footnote 3 proved that censuses could still go wrong badly. That statisticians instantly realized the implausibility of this figure, repeated the exercise eighteen months later, in 1855, and counted 91,548 inhabitants, reveals a growing statistical bureaucracy, awareness of potential problems, and strategies for improving coverage (Otero Reference Otero2006: 177–81). Setbacks and problems fueled a learning curve.
If anything, by the 1850s statisticians erred on the pessimistic side in their interpretation of census performance. Though broadly satisfied with the 1855 result, the chief statistician still surmised a possible overall under-coverage of 20 percent, without explaining how he arrived at this hunch (Rejistro 1855: 38). He may well have overestimated under-coverage with this assessment because the city’s demographers often relied on inflated population projections, which flowed from the widespread under-coverage of deaths in burial books (Dmitruk and Guzmán Reference Dmitruk and Guzmán2019: 210). Searching for systemic bugs, statisticians found one soon after the census of 1855: As the city’s cemeteries registered 28 percent more corpses than the priests had filed burials,Footnote 4 they realized they had long underestimated mortality, or overestimated growth (Registro 1857, vol. 1: 106). As a result, they also felt that their censuses had suffered more under-coverage than truly was the case. Exaggerated census pessimism was not specific to Argentina: In 1870, authorities in Philadelphia suspected an underenumeration of 28 percent and thus initiated a recount, which, however, elevated the previous result by a mere 2.5 percent (Furstenberg et al. Reference Furstenberg, Strong and Crawford1979: 478–9). At that point, their peers in Buenos Aires had grown more confident that the first national census of 1869 no longer missed a very sizeable share of the real population (Primer Censo 1872).
These likely improvements in overall coverage make it more difficult to blame census coverage for the reported decline of the Afro-descendant population, unless racially differential under-coverage worsened so much as to outweigh overall improvements. Leaving aside race, the one demographic that clearly suffered serious differential under-coverage was children. Historians have long suspected as much (Szuchman Reference Szuchman1986: 69; Massé Reference Massé, Celton, Ghirardi and Carbonetti2009), and our 1855 database confirms these suspicions. It also shows that the problem was concentrated among infants below the age of one year. Out of the 79,825 individuals counted in the surviving schedules of the 1855 census, there were only 119 infants, as opposed to 2,787 children aged one and 2,051 aged two – an evidently impossible result, perhaps owed to enumerators’ awareness of infants’ uncertain survival chances. Precisely for being so blanket, this undercount of young children did not affect Afro-descendants inordinately. In fact, if the story of low Afro-descendant birth rates and high infant mortality emerging from parish books (see below) holds true, the generalized under-coverage of children entailed relative, albeit small-scale, white under-coverage.
The existing historiography offers no clues as to whether, let alone why, the coverage of the Afro-descendant population in particular would have worsened over time – which is what we would need to find to verify the hypothesis that coverage issues fed into a progressive Black undercount. In fact, the existing scholarship once more exacerbates our analytical predicament, in that the only imputation of serious racially differential under-coverage concerns the census of 1822 and thus the early century – just as we would need an indictment for the later decades. To make this case, Johnson (Reference Johnson1979: 117–8) points to patently implausible racial gaps in the crude death rates (CDRs, annual burials per 1,000 population) provided by Goldberg (Reference Goldberg1976: 87–8) for 1822. The gap was most striking among boys below 15 years of age: 145 for free boys of color, 56 for white boys, and only 17 for enslaved boys. Understandably startled by a mortality 8.5 times as high among free-colored than among enslaved boys, Johnson refutes Goldberg’s explanation that this gap stemmed from worsening living conditions upon the attainment of formal freedom. Instead, Johnson postulates that massive census under-coverage of the free population of color artificially and incorrectly bloated Goldberg’s free-colored mortality: If the real population of free persons of color were larger, their corresponding CDR (burials per 1,000 population) would come down. In short, Johnson (Reference Johnson1979: 117–8) alleges that there was massive differential under-coverage of the free-colored population in 1822.
This allegation is an unfortunate starting point if we are looking for serious, successive worsening of differential under-coverage. But it is in any event unfounded: Considering their width and variability, the astonishing mortality gaps for 1822 reported by Goldberg cannot plausibly stem from either census under-coverage or differences in living conditions. Instead, they must be owed to unavoidably stark differences in the internal age compositions of the various cohorts, which Goldberg does not report in sufficient detail, as she lumps children (0–14) and adults (15 years or older), then breaks them down by gender and status/race (white, enslaved, and free-colored). The width of the free-colored/enslaved gap among boys (145 versus 17), noted but misinterpreted by both Goldberg and Johnson, is the telltale sign of the problem: The 1813 Law of the Free Womb, which formally freed all children born to enslaved mothers (Candioti Reference Candioti2019), effectively emptied Goldberg’s cohort of enslaved boys aged 0–14, of boys below the age of nine. Tellingly, since she has no enslaved births to account for, she provides no birth rate for the enslaved population in 1822. Whereas her cohort of enslaved boys aged 0–14 thus contained only boys aged nine or more, the opposite is true of her cohort of free boys of color, in which young children must have been very overrepresented.
Since newborns, infants, and small children died at far greater rates than children above the age of five (Coni Reference Coni1879), Goldberg’s 1822 cohort of free boys of color, which comprised such a large share of young children and infants, had an extremely high mortality. By contrast, enslaved boys died less often in 1822 because at that point they were all above the age of nine. The cohort of white boys, whose age composition was unaffected by the 1813 law, had a death rate in the middle. Tellingly, whereas the mortality gap between free-colored and enslaved was enormous for children, it was less remarkable for adults (30 vs. 25 for men, 21 vs. 14 for women), probably owing to a larger share of elderly people among free than among enslaved adults. Short of year-by-year age breakdowns, Goldberg’s 1822 mortality rates merely indicate different age compositions inside her various cohorts, which renders any conclusion from these rates pointless. They certainly tell us nothing about differential census under-coverage, as Johnson believed (Reference Johnson1979).
In order to test overall and differential coverage, it is advisable to rely not only on a confrontation of census totals with other demographic records, which have their own pitfalls, but also to search for individuals found in one census in another, so as to establish a linkage rate. Since this method requires reasonable contemporaneity, the censuses of 1836 and 1838, which produced similar results (Table 1), look like an option at first sight. But they recorded only heads of household and the total number of unnamed additional household members (racialized as either blancos or morenos y pardos). The best opportunity for linkage thus arises between the botched census of 1854 and the better one of 1855. Scholars of Afro-Argentine history have never used them, probably because the 1854 census seemed unredeemable, while the generally trusted one of 1855 was the first that did not include a question about “color.” Combining these two censuses, however, offers clearer insights into how many people, and which kind of people, were most often missing from the city’s censuses at mid-century.
Before discussing such linkage rates below, the combination of the censuses of 1854 and 1855 permits building a census estimate of the Afro-descendant population at mid-century, and thus an anchor point between the censuses of 1838 and of 1887. For this purpose, a sample of 5,000 individuals from the surviving 1854 schedules was taken, in which the number of sampled individuals per ward (cuartel), evenly spread across the ward’s surviving manuscript sheets, corresponded to each ward’s share of the citywide population according to the 1855 census. This procedure yields citywide percentages for individuals classified as moreno or negro (5.99 percent) and pardo or mulato (5.76 percent). Applying these to the more reliable total of 1855 produces an approximation of where the 1855 census would have landed, had it contained a question about “color.” The resulting number of 10,757 fits remarkably well into the long-term trajectory from 14,928 pardos and morenos in 1838 to 8,005 nonwhites in 1887 (Table 1). Taking the citywide Afro-descendant percentage of an earlier 1854 sample collected with a different method (Graeber Reference Graeber1977: 200), then applying it to the total population registered in 1855, produces a strikingly similar result: 10,647.Footnote 5
Armed with this apparent decline from 1822/1838 to 1854/1855, we can now ask why Black coverage might have significantly worsened in this period. The decline of slavery and the formation of Black households in the city outskirts are the most plausible candidates for exacerbating racially differential under-coverage. Assuming that slave owners had an interest in registering their enslaved workers on the census, while free persons of color lacked such an incentive, the rapidly falling enslaved percentage among the Black population after 1810, and the ensuing suburbanization (Maps 1 and 2), may have damaged Black coverage.Footnote 6 Although lower population density could improve census performance in the nineteenth-century US (Ginsberg Reference Ginsberg1988), unpaved roads, precarious buildings, and the lack of house numbers in Buenos Aires’s outskirts all presented challenges for census takers. The chief statistician of 1855 believed that extramuros – an ill-defined term denoting the city’s periphery – was especially vulnerable to underenumeration (Rejistro 1855: 38).

Map 1. Racial Distribution, Buenos Aires, 1838.
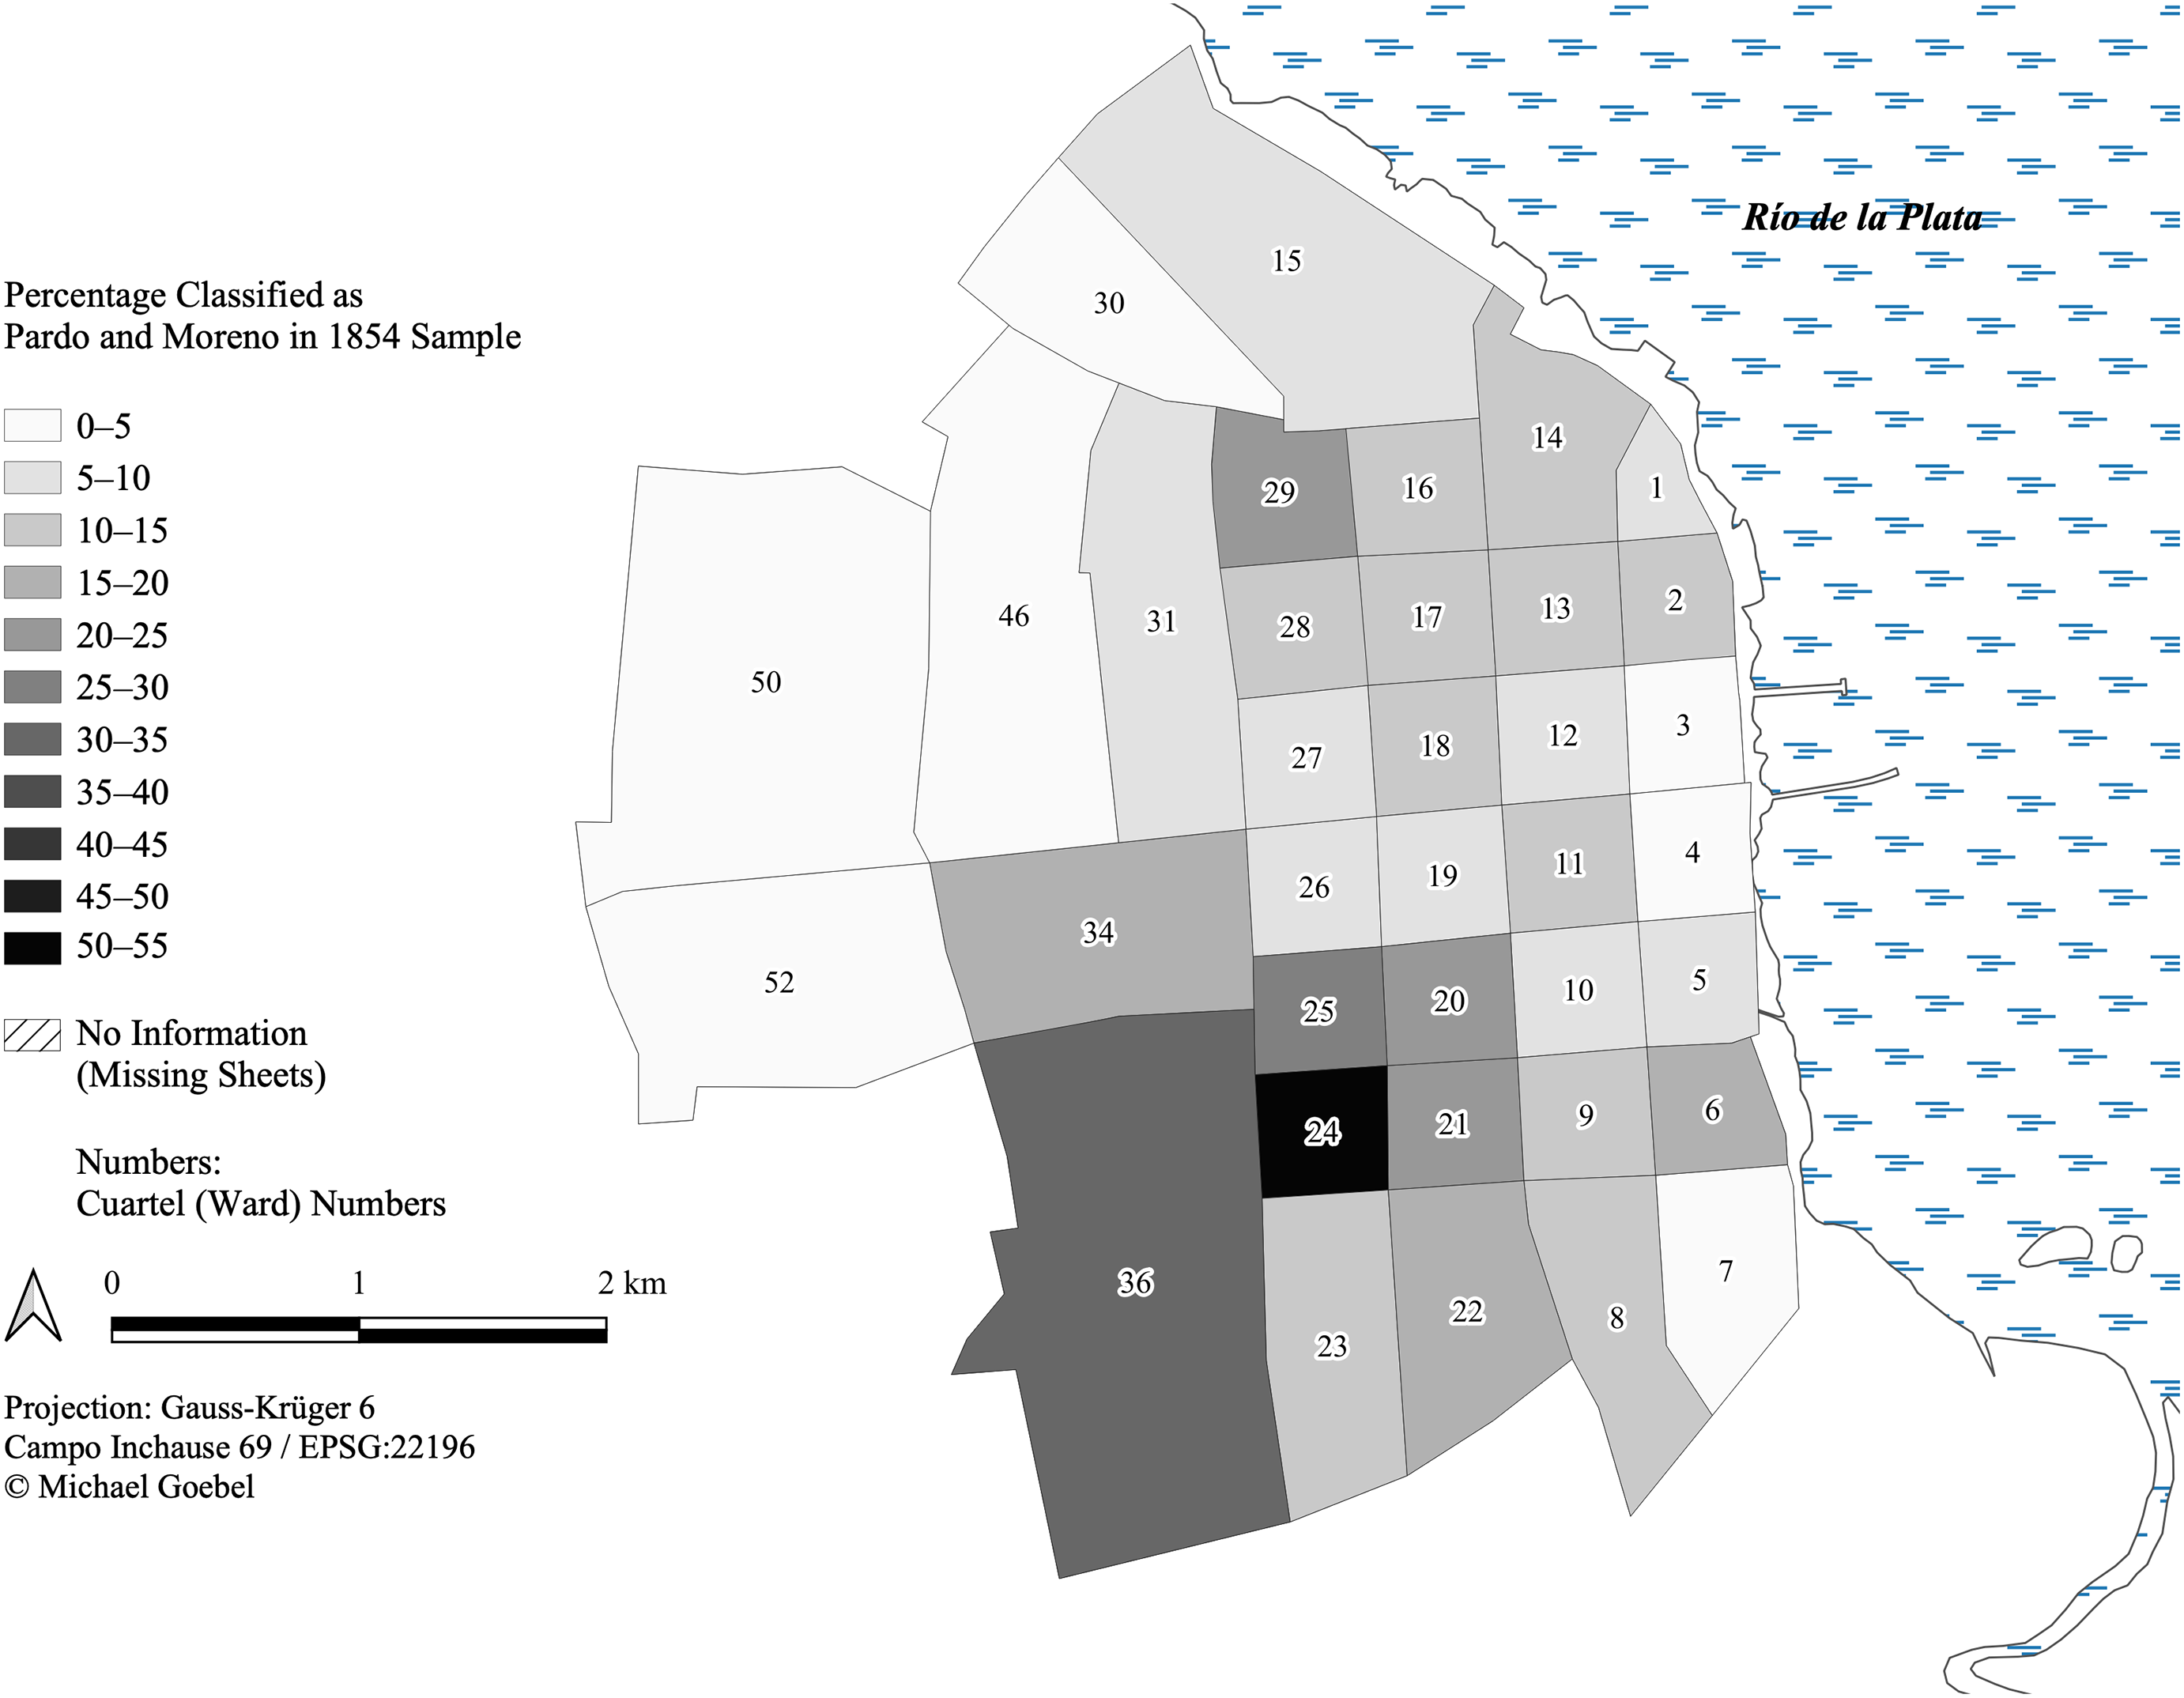
Map 2. Racial Distribution, Buenos Aires, 1854.
Yet there are reasons to doubt that the demise of slavery and suburbanization depressed Black coverage to an extent that suffices to explain the census-reported decline, especially during the relevant period after 1838. Although the decline of slavery as well as suburbanization were already well advanced by 1838 (Map 1), that year’s census produced the century’s highest total of pardos and morenos (Table 1). The main reason pushing this figure was probably the resurgence of the slave trade during the Argentine–Brazilian War of 1825–8, corroborated by the remarkable 15.7 percent of people born in Africa who told enumerators in 1855 that they had arrived in Argentina between 1825 and 1838. High rates of Black homeownership, a corollary of suburbanization, may have boosted coverage further. Even if we consider only the population aged 40 years or more, Africans had the highest rate of owner-occupants in the 1855 census (28.4 percent), well above Argentines (22.6 percent), the British (16.7 percent), and Italians (15.9 percent). The censuses of the late 1830s, which unlike all others named only heads of households, may well have magnified the general tendency of nineteenth-century censuses to perform better among owner-occupants than among tenants (Ginsberg Reference Ginsberg1988: 77). In wards 20, 21, 24, and 25 – a square of 64 blocks in which the Afro-descendant population concentrated (Maps 1 and 2) – the 1855 census counted a very similar number of inhabited houses (1,013) as the same year’s real estate tax list (1,099), which contained some properties that were unbuilt lots according to an 1872 property map and register.Footnote 7 The similarity could simply mean similar levels of under-coverage, but the presence on the tax list in these years increasingly turned into a prerequisite for notarial sales (Guzmán Reference Guzmán2009).
A citywide comparison between the 1854 sample and the 1855 database does not yield evidence that a bad census (1854) suffered more from differential under-coverage of the Black population than a better one (1855). The African-born share in the 1854 sample (1.56 percent of 5,000) was remarkably close to that in the 1855 database (1.51 percent of 79,825). By contrast, the poor census of 1854 appeared to struggle more with recording women – 48.4 percent in the 1854 sample, as opposed to 51.7 percent in the 1855 database – and with people born outside the city or state of Buenos Aires, whose share rose from 38.8 percent in 1854 to 41.6 percent in 1855 (Graeber Reference Graeber1977: 129–30 and 133). Although these changes partly reflected real migration to the city, and a likely 1854 misclassification of people as born in Buenos Aires (porteños) who in truth were born elsewhere, they do indicate that the bad 1854 census performed especially poorly with specific demographics. Most notably, the share of migrant women from the interior provinces was only 2.6 percent of the total population in the ward summaries of 1854, but then jumped to a startling 4.6 percent in the 1855 database. The comparison of the censuses of 1854 and 1855 thus suggests that a poor census had particular problems with migrants and with women, but not with the African-born.
Analyzing which ward characteristics fueled census underperformance in 1854 proves no more fruitful. The 1854 shortfall per ward, as a percentage of the ward total in 1855 (available for 30 out of 38 wards), correlates somewhat with the ward illiteracy rates recorded in 1855 (coefficient 0.51), with distance from the central Plaza de la Victoria (0.54), and with the ward’s total real estate value per square meter (0.51). It correlates less with the 1854 ward percentage of pardos/morenos (0.23). A simple regression (ordinary least squares, OLS) with the 1854 ward shortfall as the response variable and eight independent variables (Table 2) furnishes no compelling explanation as to what most drove the geographic distribution of underperformance in 1854. Lower literacy, lower rates of owner-occupancy, and low real estate values all appeared to add to the challenges of the bad census (1854), compared to the better one (1855). Interestingly, a high share of European-born also seemed to worsen census coverage in 1854, which aligns with the notion that censuses struggled with counting migrants. As to a ward’s racial composition, distance from the center, and population density, the independent effects looked much less certain. With few units (n=30), an underwhelming R-square of 0.375, high P-values, and standard errors, the entire exercise remains inconclusive.
Table 2. Predictors of ward underperformance of 1854 census (Y: 1854 ward shortfall relative to 1855 in percent of 1855 total; units: wards; n=30)

A visualization of these ward shortfalls (Map 3) reveals another key problem of the 1854 census: geographic (and household) attribution or identifying the location of enumerated individuals in space. Severe 1854 undercounts often laid adjacent to wards in which the 1854 census found just as many or even more inhabitants than the 1855 census. The 1854 enumerators returned schedules in which they simply listed individuals consecutively along a named street within a certain ward. This made it impossible to attribute people to households, and sometimes even to street blocks. The consequent frequency with which 1854-listed individuals reappeared in neighboring wards in 1855 further testified to the spatial problems inherent to the 1854 census.

Map 3. Census Undercoverage, Buenos Aires, 1854.
Apart from changes in the questions, the main novelty of the 1855 census therefore resided in clearer instructions that enumerators were to enter the data as separate households, register house numbers, and finalize street blocks before collating them into separate booklets. In addition, census takers were more carefully selected from within the ward’s population. Reflecting the perception that the enumeration of European immigrants presented particular challenges, census takers were directed to elect a deputy, “who preferably should be a foreigner if there are many foreigners on the block.”Footnote 8 Insofar as the cover sheets of finished block booklets permit identification of individual enumerators, these guidelines were implemented in 1855. In ward 20, for instance, of the seventeen enumerators completing the ward’s sixteen blocks, all except one lived on the block they counted. All registered themselves as male, literate, and between 24 and 60 years of age. Most were married owner-occupants, many were shopkeepers or small traders, and some were skilled artisans. Cross-referencing with the 1854 census and other sources identifies all as white, fourteen born in South America, three in Europe.
The various problems and the differences between the censuses of 1854 and 1855 spill into the most straightforward test of census coverage in the 1850s, which is to take a random sample of 1854-listed individuals, then search for their presence in the 1855 census. The resulting forward linkage rate is easily depressed by the difficulty of matching individuals listed in different wards in the two censuses. In addition, high mobility and mortality meant that people moved or died during the 18 months that lay between the two censuses. In the context of low literacy, the identification of individuals is further encumbered by misspellings, inconsistent surnaming practices, and age heaping. Conversely, there certainly were people missing in both censuses. As a result, a linkage rate of 60 percent cannot be translated straightforwardly into a 40 percent under-coverage.
Out of a random sample of 175 persons (86 classified as pardo or moreno) recorded in ward 24 in 1854, 125 (or 71.4 percent) could be matched to individual entries in our 79,825-strong database of the entire city, built on all the surviving and digitized sheets of the better census 18 months later. This linkage rate likely stood at the lower end of the citywide spectrum, since ward 24 had all the hallmarks supposedly undermining census performance: It was far from the center, the city’s poorest, least literate (20.5 percent according to the 1855 census), and least white (46.2 percent in the 1854 sample). The 1854 census indeed seemed to struggle in this area, yielding a ward total of only 798 inhabitants, corrected upwards to 1,148 the following year. Once more confirming the frequent omission of children, the 1854–55 linkage rate for children (below the age of 18) was much poorer (47.7 percent) than that of adults (80.2 percent).
Crucially, the exercise again fails to furnish evidence that, within the ward, Afro-descendants experienced differential underenumeration. On the contrary, of the 86 people classified as moreno or pardo in 1854, 77.9 percent could be found in 1855, compared to only 65.9 percent of the 88 persons listed as white in 1854. These samples are admittedly small, but they combine in such a way as to make it very unlikely that the census-reported decline of the population classified with labels indicating African ancestry between the 1830s and 1850s was due to worsening coverage.
More broadly, overall census coverage should be presumed to have improved during the nineteenth century. Differential under-coverage may have worsened, but probably not to an extent that would have offset overall improvements. Increasing differential under-coverage is particularly unlikely to explain the drop from the figure of 1838, when suburbanization was already well advanced, to our new estimate for 1855. Whether the even lower figure for nonwhites reported in 1887 stemmed from worsening coverage is impossible to ascertain given that the manuscript schedules of 1887 have not been preserved. Declining rates of Black homeownership and geographic dispersal from the 1850s onwards, evident in the map of districts’ racial composition in 1887 (Map 4), may have increased differential under-coverage, though again this would likely have been outweighed by citywide improvements in census quality. All told, it remains reasonable to correct upwards the 1810 and 1822 figures by a wider margin than those we calculated for 1854/55 and the ones recorded in 1887. The demographic decline of the Afro-descendant population in absolute terms would thus be steeper, adding explanatory pressure on alternative hypotheses to account for this reported decline.

Map 4. Racial Distribution, Buenos Aires, 1887.
Classification
In order to still accept the view that Buenos Aires’s community of African descent did not suffer demographic decline during the nineteenth century, or even “continued to grow,” as Andrews (Reference Andrews1980: 92) claims, it now requires an alternative explanation concerning census content, not coverage. The obvious candidate is progressive racial reclassification, or shifting racial schemas. According to Andrews’s widely accepted hypothesis (Reference Andrews1980: 89), the municipal census of 1887 recorded no more than 8,005 people of “colors” other than white (de otros colores) because of a “statistical transference of a large segment of the Afro-Argentine population from the black racial category to the white” between 1838 and 1887. This hypothesis not only demands that racial labels in nineteenth-century Buenos Aires were malleable and changeable, for which evidence is easily found, but also that classification cumulatively moved in the direction of whiteness. Notwithstanding common assertions to this effect, a detailed look at the census manuscripts until 1855 confirms no such reclassification in the direction of whitening.
Once again, the path to the finding of a “statistical transference” – or of increasing classification as white of people previously classified as pardo or moreno – is first encumbered by scholarship suggesting Black under-classification not in the mid- and late-, but in the early-nineteenth century. Pointing to travelogs of European visitors who, prior to 1830, deemed white only one-third or one-fifth of the population, Goldberg (Reference Goldberg1976: 82) posits that early-nineteenth-century enumerators “classified as white individuals who ‘technically’ were not.” Repeating the interpretive problems arising from scholarship about coverage, the upward correction of the Afro-descendant census totals between 1810 and 1838 recommended by Johnson (Reference Johnson1979: 117) and Johnson (Reference Johnson1986), this time because of alleged under-classification, ends up enlarging the subsequent drop that we need to explain. The plunge could be cushioned by late-century impressions or estimates of the nonwhite population that surpassed census results by similar – ideally, in fact, wider – margins. Such statements, however, are all but impossible to find because racial (and racist) narratives between 1880 and 1920 generally diagnosed the Black population’s decline or even “disappearance” (Alberto Reference Alberto2022).
Although the existence of a powerful and racist whitening discourse in the second half of the nineteenth century is beyond doubt, it remains unclear whether or how exactly it percolated into racial classification in censuses. As countless studies of cultural, intellectual, and political history have shown, Argentine elites were enthralled with “civilization,” which they associated with whiteness (Alberto and Elena Reference Alberto and Elena2016). A statement by the chief statistician of the municipal census of 1887, Franz Latzina, is sometimes cited as proof of Black under-classification (Ghidoli Reference Ghidoli2015: 11): “Regarding the color of the inhabitants, I must confess that the census figures are of little trustworthiness” (Censo 1889, vol. 2: 22). In 1895, census officials justified their decision to omit the “color” question altogether by surmising not only the presumably low number of nonwhites, but also their likely under-classification (Segundo Censo 1898, vol. 2: xlvi). As Otero (Reference Otero2006: 352) argues, the motivation increasingly to abstain from registering race owed as much to statisticians’ misgivings about accuracy as to elites’ overarching desires of whitening. However, any deliberate statistical strategy to substantiate Argentina’s whiteness was unattainable without a “color” question. Conversely, once the question was asked, as it was in 1887, a public admission of nonwhite under-classification, such as Latzina’s, undermined that goal. However much elites wanted to project a white country, it was far from obvious which censal tools could best achieve this goal.
The one theory in favor of reclassification that is slightly more specific turns out to be unconvincing upon closer inspection, even as it is still widely taken for granted without much scrutiny (Alberto Reference Alberto2022: 40 and 140–1; Edwards Reference Edwards, Prado, Grieco and Borucki2021: 156–7; Ghidoli Reference Ghidoli2015: 10). Andrews (Reference Andrews1980: 83–7) argues that during the middle decades of the century, the new and exceptionally blurry label trigueño (literally wheat-colored) eased the passage of people previously classified as moreno and especially as pardo into being labeled, subsequently and elsewhere, as white. Built on Carl Degler’s notion of a “mulatto escape hatch” in Brazil (Andrews Reference Andrews1980: 87; Degler Reference Degler1971: 226–32), the trigueño theory presupposes important elements of racial self-identification in censuses, whereas the less specified notion of elite racism as the main driver of census whitening tends to assume that racial categories were assigned by enumerators.
In this confusing relationship between self-identification and assignment by enumerators lies the theory’s first problem. Although censuses partly rested on information about household members by whoever opened the door, designation by enumerators was the dominant mode of classification in nineteenth-century Latin American censuses, as well as other demographic records (Loveman Reference Loveman2014: 174–5). The censuses of 1836 and 1838, in which heads of household or homeowners (as opposed to enumerators) played a larger role in classification, do not suggest that greater leeway for self-identification entailed statistical whitening. After all, they recorded the century’s largest Afro-descendant totals (Table 1), which likely had little to do with classification modes at all, but instead stemmed from the previous resurgence of the slave trade and high Black homeownership rates, magnified by household enumeration. Either way, they furnish no evidence that self-classification swayed the racial composition of results, which is the implicit assumption of the trigueño theory.
The second problem is that the label trigueño was barely used in censuses. Unlike other racial designators, the term had no legal history. Denoting complexion according to an ill-defined area on a color palette rather than descent, the records most intimately linked to ancestry, namely baptismal and burial books, never used it – if we can depend on an admittedly unsystematic survey of several thousand baptismal and burial entries between 1808 and 1870. Instead, it grew more common in records registering physical appearance, such as military muster rolls and medical documents, where it could come up alongside descriptors such as height, weight, or stature. As for censuses, trigueños popped up in one out of nine censuses conducted in the province of Corrientes between 1814 and 1857, yielding a total of 21 out of 1,078 individuals (Valenzuela Reference Valenzuela2020: 113). In Buenos Aires, it appeared in the “color” columns of the 1854 schedules – on 53 occasions in a sample of 5,000. That all these trigueños of 1854 resided in only six of 38 wards suggests that its application arose from a minority interpretation among enumerators regarding admissible answers to the “color” question. The label’s scarcity in censuses obviously hampered its potential as a vehicle for classificatory whitening.
Since the schedules of Buenos Aires’s municipal census of 1887 have not been preserved, it is impossible to say whether enumerators applied it there. No doubt based on surveying the original returns, Latzina wrote that the 8,005 nonwhites recorded in 1887 “were evidently negros, mulatos, and zambos” (Censo 1889, vol. 2: 22) – a triad that exhaustively denoted (partial) African ancestry. In his view, the entire problem concerning racial classification did not relate to people of African descent at all, but resided in that “all the graduations of mixture of Indian and European blood” were classified as blancos in the census (Censo 1889, vol. 2: 22). In the context of racial mixing and growing internal migration to Buenos Aires from the interior provinces – where racial mixing and indigenous, but not African, ancestry had long been more prevalent than in the capital – the rise of the trigueño label probably responded to a growing demand for terms beyond Buenos Aires’s heretofore dominant Black–white spectrum. As yet eliciting little interest from historians, the city census of 1887 probably under-classified indigenous much more than African ancestry.
The only more specific evidence adduced in favor of the idea that trigueño served as a whitening conduit for Afro-descendants (Andrews Reference Andrews1980: 86) does not withstand scrutiny either. It refers not to censuses, but to the racialized tables of deaths produced by the city’s women’s hospital, which in 1872–1875 registered an inexplicable jump of deaths in the colored (de color) column, to the detriment of the white column. An explainer below the 1875 table seemed to attribute this drift in the colored direction to the fact that “in the books of the hospital the trigueñas have been considered as colored” (Andrews Reference Andrews1980: 86 and 248). Doing so ostensibly differed from the customary practice of folding trigueños into white, not colored, columns (Censo general 1883: 282), of which Andrews (Reference Andrews1980: 86) disapproves because “logic dictates that trigueño would in fact be more closely associated with black racial status than with white.” Whichever choice one thinks was correct, the entire hospital episode inescapably testifies to people being moved out of classification as white, into the colored bracket. It therefore does not substantiate Andrews’s (Reference Andrews1980: 86) conclusion that “it is unreasonable to assume that, in a society as race-conscious as nineteenth-century Buenos Aires, any individual who was entitled to white racial status would settle for being termed a trigueño.”
The hospital’s death statistics are not alone in suggesting that, time and again, this was exactly what happened. Of the fifty-three trigueños in our 1854 sample, fifty-one were born in Argentina, but one was born in Italy and another in England. The 1855 sheets of one block (11) of ward 20 furnish another sample of trigueños. Not supposed to record “color,” the French-born enumerator, a 60-year-old property owner who lived on the block as a comerciante, nonetheless scribbled racial descriptors for all 242 individuals on his block into the gender column of his returns. Of the sixteen trigueños he identified in this way, eleven were born in, or had parents born in, Argentine provinces other than Buenos Aires, underlining the label’s link to internal migration. In three of the sixteen cases, the enumerator listed blood relatives (two siblings and a grandmother) whom he classified as something other than trigueño, all white. Most tellingly, ten of the block’s 16 trigueños in 1855 were traceable in the schedules of the previous year’s census, where all ten, again, were marked as white. Whether we find any of these labels accurate or not is immaterial to the inexorable conclusion that these trigueños were all “entitled to white racial status” (Andrews Reference Andrews1980: 86) in 1854, but in the following year, “settle[d] for being termed trigueños.” Being applied to people previously classified as white, the term trigueño cannot have served as a conduit of “statistical transference … from the black racial category to the white” (Andrews Reference Andrews1980: 89).
A comparison of all the racial designations of the residents of the same block in the censuses of 1854 and of 1855 fails to furnish other promising hypotheses of census whitening (Table 3). Just as the 1854–55 forward linkage rate from ward 24 (discussed above) was lower for whites than for nonwhites, so was the 1855–54 backward linkage rate for block 11 in ward 20 here (Table 3). While there was some classificatory mobility within the blanco–trigueño–chino spectrum, ostensibly enabled by the absence of the labels trigueño and chino in 1854, as well as within the moreno/negro–pardo spectrum, the boundary between these two spectrums was less permeable. Of a total of 107 people recorded in 1854 and findable in 1855, only one person crossed it, from parda in 1854 to blanca in the following year. In short, while there was considerable flexibility in racial labeling within the Afro-descendant spectrum, the boundary around the compound of labels denoting African ancestry was not especially permeable.
Table 3. 1854 linkage of racially classified individuals in 1855 census, block 11, ward 20

Regardless of the shortcomings of the presently available explanations of how a census shift into whiter categories may have occurred, it is not altogether impossible to test whether it happened, at least until 1854/1855. This can be done by approximating, as much as possible, the classification of an identical cohort of people through time: Goldberg (Reference Goldberg1976: 87) furnishes the citywide racial composition of children aged 0–14 years in the census of 1822, who can then be compared to people aged 32–46 in our 5,000-strong sample from the 1854 census. By comparing the racial composition of this aging cohort in 1822 and in 1854, the method is designed to test whether an identical group of people, as it moved through time, was reclassified in a “statistical transference.” Since the 1854 sample aged 32–54 logically cannot comprise children of the children aged 0–14 in 1822, interference from racial mixing is ruled out. In order to corroborate reclassification in the direction of whitening, we would need to find a growing white share and a declining compound share of pardos and morenos, as the cohort aged from 1822 to 1854.
Three issues undermine the premise that Goldberg’s cohort of children in 1822 matches those aged 32–46 in our 1854 sample. The first, and least worrying, is shifting differential coverage, which, in light of the discussion above, is unlikely to have mattered all that much. The second is migration: some of the 1822 children were no longer present among the 1854 adults because they left the city, while the 1854 sample contains adults not yet present in the city as children in 1822. In order to minimize interference from migration, Table 4 specifically looks only at Argentines and porteños (born in Buenos Aires) in 1854. This limits the problem of migration, insofar as the Argentine and especially porteño adults of 1854 should approximate Goldberg’s children of 1822, who, considering the vicissitudes of the slave trade and of international family migration, must overwhelmingly have been born in Argentina, mostly in Buenos Aires.
Table 4. Racial composition of age cohort in Buenos Aires censuses of 1822 and 1854

Table 5. Baptisms and burials in the parish books of Socorro, 1864

The third and most important factor that impairs the assumption that the 1854 adults were identical to the 1822 children is that some of the children of 1822, of course, died before 1854. Racial mortality differentials consequently altered the racial composition of the adults of 1854 compared to the children of 1822. If we believe a detailed recent study showing significantly higher mortality for Afro-descendants than for whites (Dmitruk and Guzmán Reference Dmitruk and Guzmán2022), we must assume a higher white share in 1854 than in 1822 because of mortality alone. To be precise, in light of the 1822 racial composition, the racial mortality differentials found by Dmitruk and Guzmán (Reference Dmitruk and Guzmán2022: 76–78) would by themselves have produced more than a three-percentage-point gain in the white share and a corresponding loss in the Afro-descendant share between 1822 and 1854. Bearing this in mind, the white drift in the cohort’s racial composition should significantly exceed three percentage points, if we want to be certain that it truly corroborates racial reclassification in the direction of whitening.
Yet no such shift occurred in the racial composition as the children of 1822 grew into the adults of 1854 (Table 4). Though there was a drift from moreno toward pardo, the share of whites remained remarkably stable. Looking at girls and women only is even more revealing because it helps reduce interference from real mortality differentials. The low male-to-female ratio of pardo and moreno children in 1822 signaled high infant mortality, which generally (in Argentina as much as elsewhere) affected boys more than girls. The further drop of these ratios in the adult cohort of pardos and especially morenos, in turn, indicated high death rates among men in military conflicts. Assuming smaller racial mortality differentials for women, the declining white share in the female cohort most conclusively contradicts the hypothesis of census whitening through reclassification. The female percentage gains in the parda and indigenous brackets, meanwhile, could stem from internal migration. Some reclassification of morenas into pardas remains plausible, but sizeable transfers into the white bracket between 1822 and 1854 can conclusively be ruled out.
In other words, reclassification cannot be blamed for the decline from the total of pardos and morenos in 1822 (13,685) to the 1854/1855 estimate of 10,757. Whether, in a reversal of previous trends, a “statistical transference of a large segment of the Afro-Argentine population from the black racial category to the white” (Andrews Reference Andrews1980: 89) occurred between 1854/55 and 1887 is impossible to ascertain in the absence of the 1887 schedules. Because of the relatively small drop from our 1854/55 estimate to the 1887 result, such a putative transference in any case no longer needed to concern a “large segment.” Either way, census analysis by itself corroborates conclusively that a real and significant absolute demographic decline was underway between 1838 and 1855, which stemmed neither from worsening coverage nor from reclassification. It is not clear what could have reversed that trend, given that demographic developments create their own path dependencies.
Vital statistics
The analysis of vital statistics further undermines the theory of census whitening. Discussing births and deaths encompasses two traditional explanations for the decline of the Afro-Argentine community: high death rates in wars and in epidemics, but by definition excludes a third, emigration. Again, the discussion here concerns absolute, not relative, growth or decline. How birth and death rates within the population of African descent compared to those of the white population is insubstantial to this purpose, even if it is widely agreed, and easily demonstrated, that white birth rates were higher and death rates lower than those of the African-descended population (Dmitruk and Guzmán Reference Dmitruk and Guzmán2022); a difference helped by growing numbers of European immigrants heavily concentrated in the reproductive age brackets (Moya Reference Moya1998).
Although a surplus of Afro-descendant baptisms over burials theoretically indicates demographic growth, this assumption requires caveats concerning both coverage and content, which can affect parish books as much as censuses. Concerning coverage, equating registered baptisms with births and registered burials with deaths was a widely accepted, and the only available, demographic method for vital statistics prior to the introduction of a civil registry in 1884. On the baptismal side, the decline of the slave trade ensured that after 1830, parish books no longer contained a significant number of baptisms of enslaved adults, so that baptisms effectively represented births. According to demographic historians (Dmitruk and Guzmán Reference Dmitruk and Guzmán2019: 203), baptismal books in nineteenth-century Buenos Aires missed only a trivial number of births, irrespective of race.
But a significant number of deaths failed to materialize in burial books. As cemeteries in nineteenth-century Buenos Aires were not racially or religiously segregated, the problem likely stemmed mostly from deaths of (former) city residents in military conflicts outside of the city and from people shunning the higher cost of burials compared to baptisms. With the city’s demographic losses unaccounted for more often than its gains, baptisms/burials ratios generally require a slight downward correction, if what we want are births/deaths ratios. While a ratio below 1.0 clearly signals demographic decline, one that barely exceeds 1.0 does not instantly certify growth.
Regarding racial classification, holding Afro-descendant baptisms against burials rests on the premise that priests attached racial labels to baptized babies in the same way that they did to decedents. Andrews’s notion that people were reclassified in the direction of whitening during their life cycles interferes in unfortunate ways with this assumption of a womb-to-tomb racialization equilibrium in the city’s parish books. Had people moved from nonwhite into white categorization, on a significant scale and in the course of their lives, we would have to suspect that babies baptized as pardos or morenos were later buried as blancos. If we now emerged from the parish archives with a surplus of Afro-descendant baptisms over burials, which is what Andrews claims to have found (Reference Andrews1980: 89–92), this alleged finding no longer testifies to demographic growth: Maybe it does not mean that there were more Afro-descendant births than deaths, but merely that people were reclassified in the course of their lives. A logical impasse unacknowledged by Andrews and other authors upholding his theory, the notion of classificatory whitening undermines trust in the only finding – more Afro-descendant baptisms than burials in parish books – that can possibly bolster the idea that Buenos Aires’s Black population “continued to grow.”
Unfortunately, there is no straightforward answer to the decisive question of whether the priests racially marked their baptisms and burials in comparable ways. Unlike censuses that included a race question, which obliged enumerators to mark every person’s “color” on a preprinted form, parish books did not compel such uniform racialization. Until the 1820s, record keeping in most parishes was segregated into baptismal and burial books for whites, and other books for people of color (gente de color). Thereafter, however, the gradual and haphazard desegregation of parish records created serious quandaries for racial vital statistics. Each parish integrated its books at a different moment in time. Some parishes integrated either their baptismal or their burial books first, while they kept the other segregated for longer. This non-simultaneity of book desegregation encumbers the juxtaposition of racially marked births and deaths, since in their integrated books the priests interspersed white with explicitly nonwhite baptisms and burials, without consistently racializing the entries. In a habit acquired in the era of segregated books, priests rarely classified whites as such in their integrated books. Yet they were also inconsistent in marking their entries for babies and decedents they deemed nonwhite. We therefore cannot simply treat all unmarked entries as if they were classified as white.
In the 1820s, when the books were still segregated, we are on safer ground in terms of the original record. The books for people of color included some baptisms and burials of people labeled with terms designating indigenous, not African, ancestry, but their share was too small to make a significant impact.Footnote 9 The crude birth and death rates that Goldberg (Reference Goldberg1976: 87) provides for whites and nonwhites for the year 1822 are derived from that year’s census and a straight equation of baptisms and burials with births and deaths. Since they suffer, as discussed above, from disregarding the statistical distortions that the 1813 Law of the Free Womb brings into the rates, they have to be calculated backwards to arrive at the total of colored baptisms and burials for 1822. Dividing the former by the latter yields a ratio of 0.67 – that is, an alarming excess of burials over baptisms (see Table 6). As her figures also show, infant mortality was an important culprit, which in 1828 stood at roughly 400 per 1,000 colored births, as opposed to 250 for whites (Reference Goldberg1976: 88). Goldberg also offers an “average” ratio of baptisms to burials for the entire decade from 1822 to 1831, which she tallies at a shocking 0.19 (Reference Goldberg1976: 90). The figure is so low as to beggar belief, especially since a later recap of the colored parish books of 1929 – a year with bad bouts of measles and smallpox – produced a ratio of 0.74 (Registro 1858: 135–7).
Table 6. Afro-descendant baptisms/burials ratios for select years, Buenos Aires

The next available datapoint, again provided by Goldberg (Reference Goldberg1976: 95), this time for 1837, suggests a slight demographic recovery, but by no means robust and sustained growth. Though her data again show a dramatic racial gap in infant mortality (395 for 1,000 colored births, as opposed to 250 for white infants), she comes down at a ratio of 1.13 colored baptisms per burial for 1837. While there is no obtrusive reason to distrust this ratio, it remains unclear how she collected and racialized the data. Explicitly writing that the priests no longer sent annual summaries, since the statistical office demanding them had been shut, she must have manually counted all baptisms and burials from the original books of nine of the city’s then eleven parishes, to arrive at her figures. Even assuming a sound collection method and consistently segregated books (not a likely scenario in 1837), it should be noted that, regardless of race, the 1830s were a decade with high natality and rapidly falling mortality, resembling the second stage of the demographic transition, which, however, faded quickly in Buenos Aires (Lattes et al. Reference Lattes, Andrada and Caviezel2010: 135).
The 1850s series that Andrews (Reference Andrews1980: 90) cites in support of his growth thesis, by contrast, spotlights the problems inherent in these records more glaringly. The numbers at first sight indicate a surplus of colored births over deaths. But the highest ratio, of 1.67 in 1857 (Registro 1857, vol. 1: 103–5), stems precisely from the year in which the statistical yearbook noted, on the very page following the racial breakdowns of baptisms and burials (106), that the parish books had missed a whopping 28 percent of citywide deaths. Closer inspection reveals the 1854–57 rise in the ratio to have derived from a strangely precipitous 31.6 percent drop in burials marked as colored, whereas colored baptisms suspiciously declined too, but only by 19.4. percent. The breakdown by parishes (Registro 1857, vol. 1: 103–5) further erodes confidence: Whereas Monserrat, the heartland of the Black community, filed 63 colored births over 128 deaths, the adjacent parish of Concepción registered 110 colored births over 5 deaths.
The patently implausible series was probably an artifact of the books’ asynchronous integration and de-racialization in exactly these years, in which the decline in classification in some books outpaced that in others. The authors of the yearbooks understandably mistrusted the priests’ numbers. In 1855, they sent a circular letter to all priests, reminding them of their statistical duties, and (until 1860, fruitlessly) tried to implement the use of standardized forms for parish books (Registro 1855: 26–7). The statisticians’ palpable misgivings must have motivated their decision to discontinue the publication of racialized vital statistics in their 1858 yearbook – and not, as Andrews conjectures (Reference Andrews1980: 90–1), their alleged unhappiness about figures indicating that colored births surpassed deaths.
The only conceivable remedy for the period from 1840 to 1884 is manual recounts in individual parishes. Starting in the heartland of the Black community, the 1861 books compiled by the priest of Monserrat, Manuel Velarde, present a startling snapshot of untrustworthiness.Footnote 10 Like most of his peers, Velarde hardly ever attached racial labels to babies or decedents he ostensibly deemed white. He did use labels denoting African descent, but clearly not always: 25 of his 33 decedents born in Africa lacked a racial tag, perhaps because he deemed it superfluous. In addition to the 35 baptisms of children who he expressly designated as pardo or moreno, he noted 11 baptisms of racially unmarked children who, however, had African-born godparents – unlikely to have been all white. Several of his racially unmarked deceased infants had been tagged as moreno or pardo upon baptism, either by him or by a colleague in another parish, or had siblings labeled moreno or pardo. Following common practice (Alberto Reference Alberto2022: 33), Velarde’s use of the honorific titles don and doña was pointedly racist, but on rare occasions, he withheld these titles from ostensibly white people and instead extended them to people he expressly designated as pardos. There is no way to re-racialize a record that, unlike censuses, was incompletely racialized at the source. But there is no viable path either to the conclusion of demographic stability, let alone growth: The parish’s explicitly racialized entries in 1861 produced a baptisms/burials ratio of 0.88. If we include unmarked babies with African godparents on the baptismal side, and the African-born among the decedents, the ratio drops to 0.69.
Since Monserrat’s population of African descent was older on average than that of the whole city, a look at other parishes remains worthwhile. An exception among his peers, the priest of Socorro, Santiago Franchi, consistently racialized his baptismal and burial books in 1864.Footnote 11 Unusually, he also labeled white babies and decedents with the letter “B” for blanca/o. Socorro’s catchment area (comprising wards 1, 14, 16) and the military barracks there made its small Afro-descendant population disproportionately pardo and young, compared to the city as a whole. Even so, the Afro-descendant baptisms/burials ratio of 0.98 derived from Franchi’s 1864 books again fails to move us into the territory of demographic growth (Table 5). Infant mortality, with rates and a racial gap resembling Goldberg’s data for 1822 and 1837, was responsible for around one-half of the total racial gap in the ratios. Much of the rest can be explained with the Black population’s older age composition compared to whites, which in turn sprang from the long-term demographic trajectory and immigrants’ heavy concentration in the 20–40-years age bracket.
We only reach safer terrain with the introduction of civil registration in 1884, which during that decade also recorded “color.” Furnishing yet more evidence against demographic stability or growth, the civil registrars’ summaries for 1887 (Censo 1889, vol. 2: 410 and 486) reported an excess of deaths of people classified as negro (260) over births to parents of whom one parent was labeled as negro (171), yielding a births/deaths ratio of 0.66 – as opposed to 1.31 for whites. Since the category defining the dividend differed from that of the divisor, with only 83 births to parents both classified as negra/o, the ratio requires another downward correction, lest we compute racial mixing purely as a form of growth of the African-descended community. These civil registry numbers and the same year’s census total of 8,005 colored residents, which, of course, flowed from independent sources, mutually stabilize the credibility of each, as we would now end up with a low but reasonably unsuspicious CBR of 21.4 and a CDR of 32.5.
Reconsidering, then, the entire series of ratios between the 1820s and 1880s (Table 6), negative growth unmistakably emerges as the dominant tendency in the vital statistics for Afro-descendants. Pessimistically taking the lowest ratios (of 1822 and 1887) as representative of the whole 1822–87 period, assuming a turnover of two generations within this timespan, then starting from the 1822 census, the ratios alone would account for a total decline of the African-descended population to 6,268 in 1887; below that year’s recorded total of nonwhites (8,005), but even below the 7,099 Argentine-born nonwhites.Footnote 12 Inverting the method, ignoring birthplaces, and assuming an even migration balance, the census data produce a global births/deaths ratio of 0.73 for 1822–87. This remarkable alignment between the censuses and vital statistics, derived from two very different kinds of sources, makes it nearly impossible to deduce demographic stability, let alone growth.
More problematically still for the stability/growth thesis, all of the births/deaths ratios discussed above barely scratch the surface of the two most common traditional explanations of the African-descended population’s decline: epidemics and wars. Deaths caused by epidemics should, in principle, materialize in burials, but the ratios in Table 6, with the partial exception of 1829, fell into years outside of the most serious episodes: cholera in 1867–68 and in 1874, and a devastating yellow fever epidemic in 1871, which, according to a list of all victims, carried off a whopping 7.3 percent of the city’s entire population recorded in the 1869 census (Acevedo Reference Acevedo1873: 307; Primer Censo 1872). This particular scourge clearly hit European immigrants most severely, killing 9.5 percent of the Spanish-born and 11.9 of the Italian-born recorded in the 1869 census, yet only 3.8 of Argentines and 0.8 of Africans. Cholera, which does not afford acquired immunity in the same way, awaits scrutiny. Either way, the demographic decline suggested by Table 6 does not comprise the most important epidemics.
Nor does that table account for many deaths in military conflicts – an easily verifiable demographic factor of very serious proportions for Buenos Aires’s men of African descent. Evidence of an overrepresentation of Black men in virtually all armies in the nineteenth-century Río de la Plata region is overwhelming. Early in the century, military service became a vehicle for the enslaved to achieve freedom. It then continued to be a means of upward social mobility, as well as a source of legitimizing claims to national belonging (Borucki Reference Borucki2015: 84–146; Guzmán Reference Guzmán2014; Mallo and Telesca Reference Mallo and Telesca2010). Mid-century testaments of Africans and Afro-Argentines abound with references to missing sons who had left to participate in wars.Footnote 13 The reasonable assumption that the share of Afro-Argentine deaths in military conflicts even exceeded their disproportionate representation in armies is harder to verify, but the latter in itself sufficed to produce far higher mortality rates among Black than white men, as shown by Dmitruk and Guzmán (Reference Dmitruk and Guzmán2022).
Consistent and conclusive corroboration for the military dimension comes in the form of gender-age pyramids of Buenos Aires’s African-descended population in the 1820s, provided by Andrews (Reference Andrews1980: 73). The low male-to-female ratios calculated by other scholars (Goldberg Reference Goldberg1976: 85) and our own sample of 1854 (Table 4) reveal much the same. Here again, the death toll of Afro-descendant men in military conflicts – for instance, in the Wars of Independence, the Argentine–Brazilian War, Uruguay’s Guerra Grande, and the War of the Triple Alliance – was unlikely to materialize in the ratios of Table 6. Much of the bloodshed fell into years other than those computed. And since most such deaths at any rate occurred outside of Buenos Aires, they did not usually flow into the city’s burial books. The ratios still do not account for a significant number of deaths of adult men.
The gender imbalance resulting from Black men’s deaths doubtless fueled racial mixing, further promoted by high male-to-female ratios among European immigrants (245 men for 100 women in our 1855 dataset). Documenting widespread racial mixing in the interior city of Córdoba, Edwards (Reference Edwards2020: 66–84) attributes it to a deliberate whitening strategy of Black women rather than to an inescapable demographic imbalance. Whatever the chief driver, all demographic sources show that racial mixing was very common. Parish books consistently recorded a higher moreno share in their burials than in their baptisms. Notwithstanding his dismissal of racial mixing as an engine of reported demographic decline, Andrews provides samples of Afro-descendants from the 1827 census that testify to a rapidly growing pardo share relative to the 1810 census, which, in his own words (Reference Andrews1980: 89), corroborated a “lightening process” at a “rapid pace.” Goldberg’s table (Reference Goldberg1976: 87) based on the 1822 census shows a much higher moreno share among pardo/moreno adults aged 15 or more (67.5 percent) than among children (54.4 percent). In our 1854 sample, the moreno share was again higher in the Afro-descendant cohort above 15 years (53 percent) than in the one below (43.8 percent).
Since births/deaths ratios within city limits, mortality in military conflicts, and racial mixing more than sufficed to account for the census-reported drop of Buenos Aires’s population of African descent between 1838 and 1887, discussing net migration balances into and out of the city seems nearly moot. One traditional popular explanation of the community’s decline cites migration from the city toward adjacent areas of the Río de la Plata basin, especially Uruguay. Endrek (Reference Endrek1966: 18) documents some Black migration from Buenos Aires to the Argentine interior in the early nineteenth century, though without quantifying it. Andrews (Reference Andrews1980: 75) suspects a net balance of internal migration between the 1830s and the 1880s in the city’s favor. Irrespective of race, migration balances between the city of Buenos Aires and the rest of Argentina are nearly impossible to tally, but widely assumed to have favored the capital. The balance (again, irrespective of race) between Uruguay and Buenos Aires, which is more easily verifiable, increasingly leaned in favor of the latter (Goebel Reference Goebel2010: 202). A majority of the 906 nonwhite foreign-born residents in the 1887 census (11.3 percent of the nonwhite total) were likely Afro-Uruguayans. Nonetheless hypothesizing net Black migration out of Buenos Aires requires us to believe that migration to the Argentine capital from adjacent regions was disproportionately white, whereas out-migration for some reason had the inverse racial composition; not a compelling scenario. The more plausible assumption is that migration increased Buenos Aires’s African-descended population, though not in large numbers.
Conclusion
After more than 40 years of shelf life and a remarkable invigoration in the past decade, it is time to put to rest the hypothesis that the census-reported decline of Buenos Aires’s African-descended population during the nineteenth century stemmed chiefly from increasing under-coverage or under-classification. This assumption has long suffered from imprecision of how either came about and especially of how either factor worsened without the resulting omissions being offset through gains elsewhere. If we give credence to a serious undercount early in the century (Johnson Reference Johnson1979), the reported drop between the century’s early censuses and that of 1887 increases, adding pressure on our possible explanations of where and why enumeration turned even worse later.
In fact, the assumption that the census coverage of Afro-descendants worsened over time has never been seriously entertained. The best candidates for such an assumption are geographic dispersal and declining rates of Black homeownership between 1854/1855 and 1887. Yet even if differential under-coverage indeed worsened between 1810 and 1855, it was most likely outweighed by improved overall coverage. If coverage cannot be blamed, the entire explanatory onus is on racial reclassification – which scholars have most commonly suspected as the chief culprit. Yet there is no compelling evidence against this suspect either. The term trigueño, which historians following Andrews have treated as a vehicle of whitening, was rarely used in censuses. When it was, it was applied to people previously labeled as white. Comparing the composition of racial classifications of one age cohort in 1822 to its composition in 1854 conclusively disproves reclassification in the direction of whitening.
With both coverage and classification issues ruled out for the 1822–55 period, our estimates of the Afro-descendant population in 1854/1855 demonstrate, as irrefutably as possible, that a serious demographic decline was underway between the 1830s and the 1850s. Since an ageing population creates its own demographic path dependency, it is hard to imagine how this trend could have been reversed between 1855 and 1887. It is just as difficult to develop a theorem of why and how exactly unidirectional reclassification would have occurred only in the 1855–87 period, but not in the previous decades.
Persuasive corroboration of demographic decline comes from the vital statistics that emerge from parish books. This is not merely a matter of a different source operating on the same racial schema that erased Afro-descendants from the records. In order to dismiss the parish books’ remarkably consistent surplus of burials over baptisms tagged as pardo or moreno, we need to believe that priests systematically racialized burials more than baptisms – in a context in which the use of baptismal entries as proto-identity cards, as well as Andrews’s theory of life-cycle whitening, both suggest the opposite. In the 1880s, civil registries, which evidently compelled racial labels in the entries of both births and deaths, again corroborate negative growth. The entirety of the century’s demographic record, which has become more accessible and usable through digitization, presents multiple problems. But it is consistent and conclusive in indicating demographic decline – with infant mortality and deaths in military conflicts as the most readily evident culprits.
Decline is not “disappearance,” and it is unhelpful how much of the scholarship continues to frame the debate with this unfortunate term. The larger debate about Argentina’s African heritage and its (in)visibility (Alberto Reference Alberto2022: 12–3 and 35–6; Geler Reference Geler2010: 17–9; Ghidoli Reference Ghidoli2015) in any case owes much less to changes in the absolute numbers than to the relative demographic share of Afro-descendants. What most fueled turn-of-the-century commentary about “disappearance” was no doubt relative decline, which overwhelmingly stemmed from massive European immigration. Considering that in 1914 more than 740,000 people born in Europe resided in the city of Buenos Aires alone – a figure that excluded not only their Argentine-born children, but also the descendants of several previous immigrant generations – puts the story into a wider demographic frame. Even if we counterfactually assume an absolute demographic stability of the population of African descent from 1838 onwards, its relative share would have dropped from 26 percent of the city’s total in 1838 to 3.4 percent in 1887 and to 0.9 percent in 1914. From this societally more encompassing angle, the “riddle of the disappearance,” which Andrews (Reference Andrews1980: 3–9) posits, looks distinctly unmysterious.
The mystery pales further once we compare Buenos Aires to other Latin American cases instead of the United States. As Diana Paton (Reference Paton2022) has recently stressed, slavery in Latin America depended on the reproductive labor of women in Africa, whose kidnapped offspring sustained the continuation of the massive slave trade. In contrast to the low birth and high death rates among Latin America’s enslaved populations, for much of the eighteenth and nineteenth centuries, the United States was the only large country in the Americas where the enslaved population reproduced itself without the constant slave trade. According to Steckel (Reference Steckel, Smith and Paquette2012: 650), by 1825, “other slave populations [outside of the U.S.] would have shrunk (rapidly) except for imports.” What most distinguished Buenos Aires’s nineteenth-century demographic history from that of other places in Latin America was the massive scale of European immigration, not the negative demographic growth of its Afro-descendant population.
To “disarm the customary narratives about the supposed disappearance of the Black population, in order to show, in turn, that it has always been and continues to be there” (Adamovsky Reference Adamovsky2023) pursues a valuable anti-racist goal. Such a disarmament can serve as a tool to challenge Argentina’s self-image as a white country and to corrode the self-congratulatory misconception that Argentines have nothing to answer for in debates about slavery and racism. But the pursuit of present-day goals, however, legitimate or necessary, should not bind historians to an edifying tale that downplays the readily evident demographic effects of injurious living conditions. For that same reason, the Afro-descendant community’s demonstrable demographic decline during the nineteenth century should not be dismissed as a “natural” process. Violent deaths in military conflicts, as well as an atrocious racial gap in infant mortality, were outgrowths of entrenched, human-made inequalities. These deserve serious historical analysis.


 Open access